Large-scale genomic analysis reveals recurrent patterns of intertypic recombination in human Enteroviruses
Recombination is a driving force for the emergence, evolution and virulence/epidemics of Enteroviruses, a major genus of Picornaviridae important for human and animal health. By analyzing 2949 complete genomes/coding sequences, we provide for the first time a thorough and global overview of the patterns of intertypic recombination and hotspots between the genogroups of this genus. Two prominent recombination hotspots are identified, at the 5UTR-capsid region junction, and at the beginning of the P2 region. In general, P2 was enriched in recombination events. Key phylogenetic groups implicated in recombination events are E71 and CVA6 in Enterovirus A species, E30 and E6 in Enterovirus B species, Poliovirus 1 and 2 in Enterovirus C species. In addition, many recombination events involve donors that have not been sequenced yet, thus strongly suggesting an enormous environmental reservoir of genetic variation with a high potential for the emergence of new modified pathogens by recombination.
Major findings:
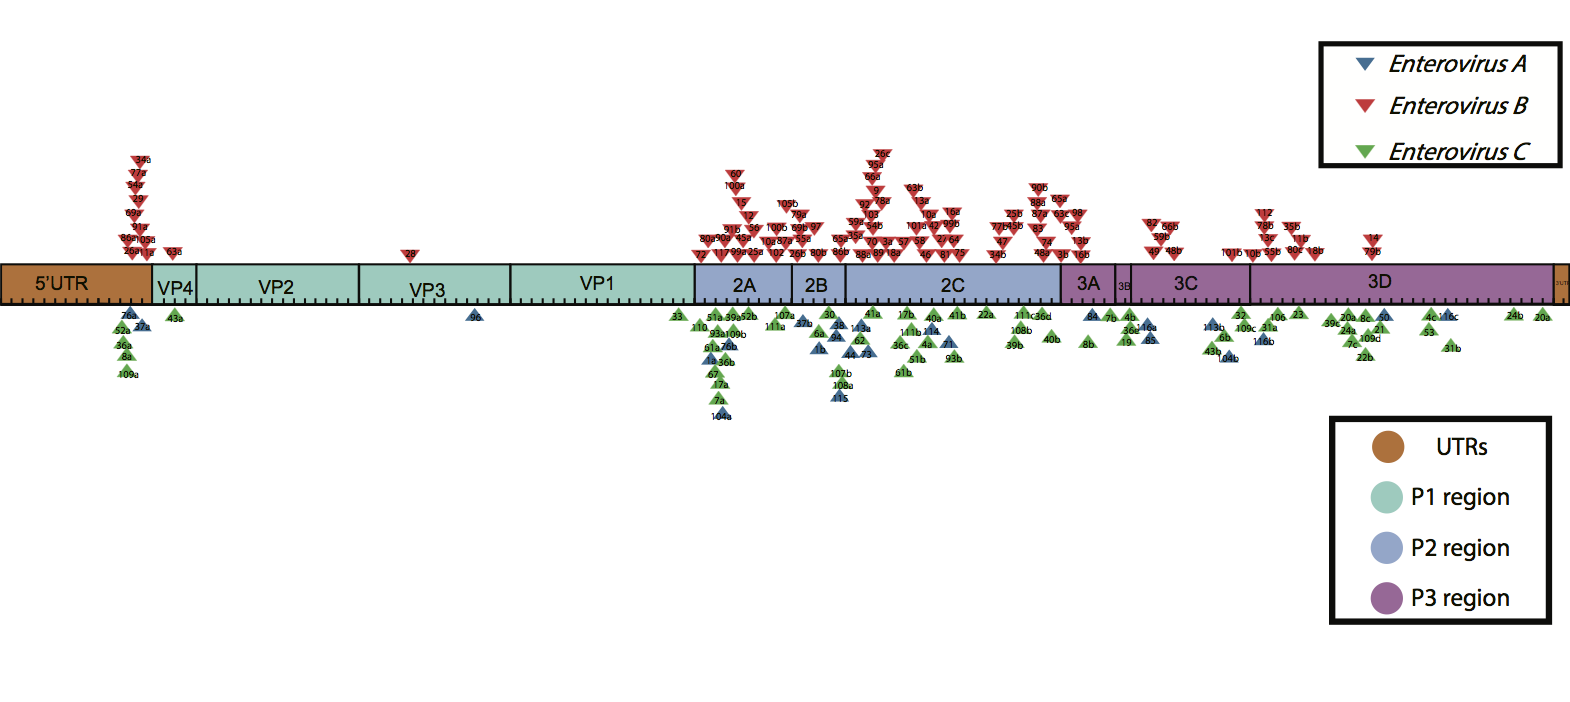
- The capsid region is a recombination coldspot in EVs.
- The 5UTR-VP4 junction is a recombination hotspot.
- P2 is a recombination hotspot, especially in EV-B & EV-C.
|
|
Figure 1. Recombination events in Enterovirus A, B and C. Triangles depict recombination events. Numbers within triangles correspond to recombination event numbers in supplementary files S19 & S20.
|
|
|
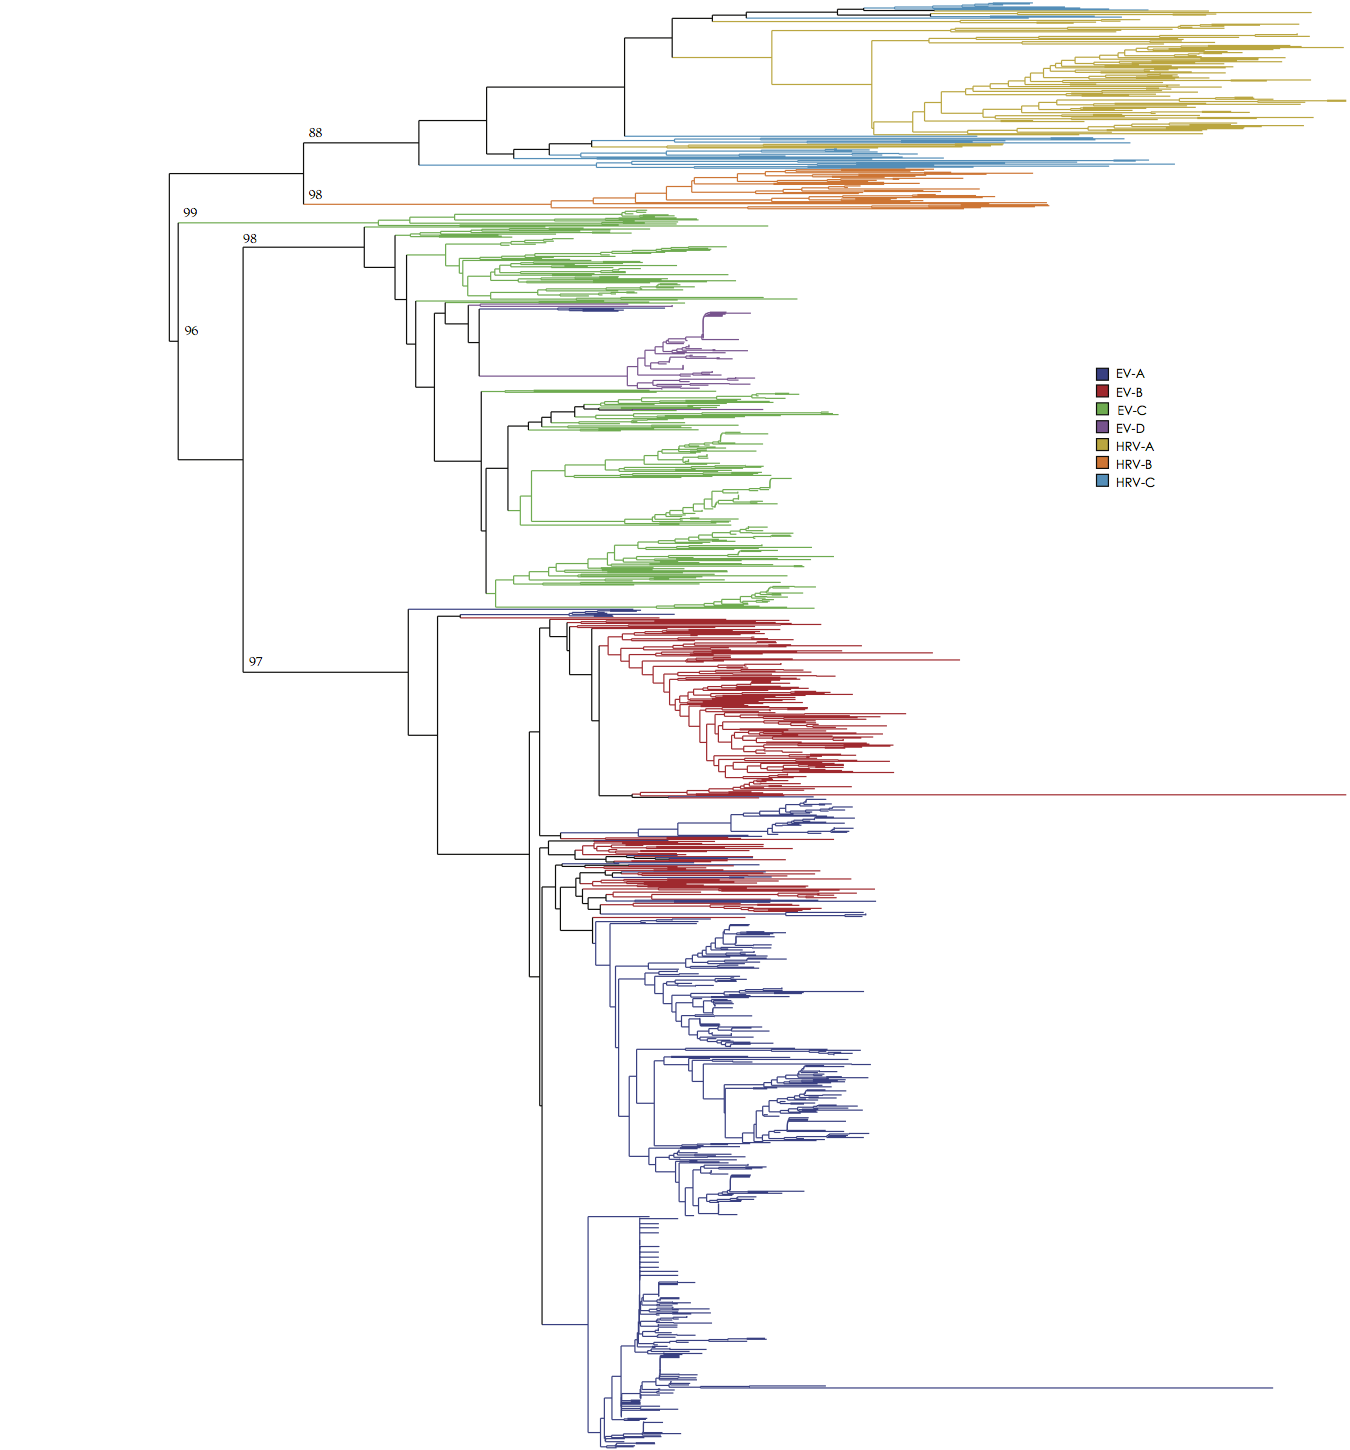
Figure 2. BioNJ phylogenetic tree of the 5’UTR of human Enterovirus A-D and human Rhinovirus A-C sequences. Colors correspond to each of the 7 species. Bootstrap values are depicted for each major cluster.
|
Key players in recombination events:
|
|
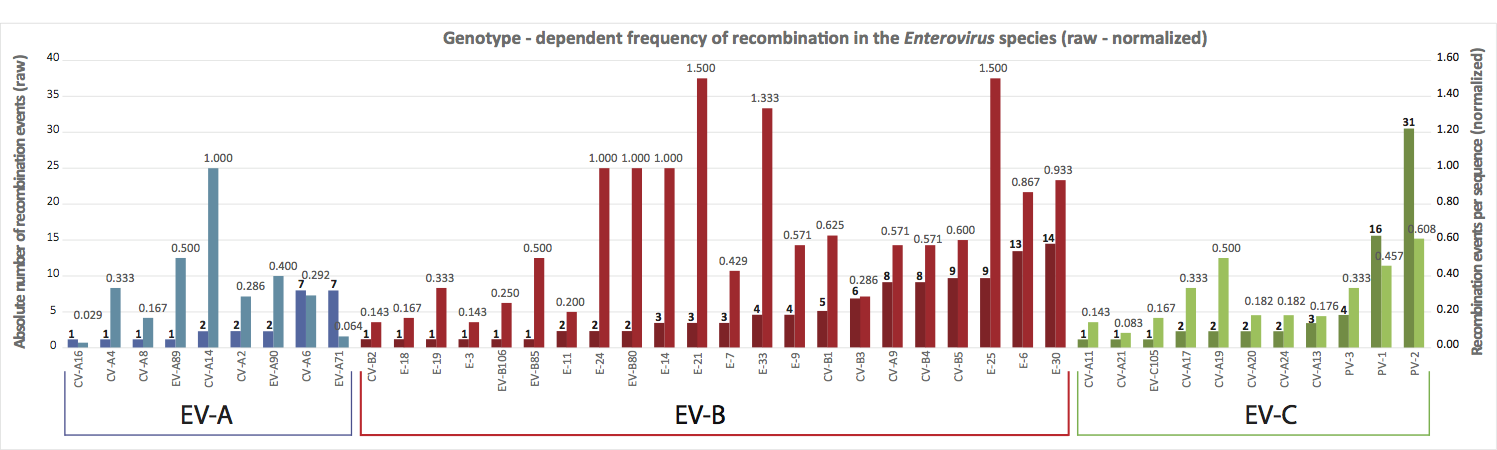
Figure 3. Recombination events per genotype. Dark coloured bars correspond to absolute number of recombination events per genotype. Some genotypes have many sequences in databases and this bias is not taken into account. On the other hand, these genotypes more frequently cause clinical symptoms/epidemics. Light coloured bars correspond to normalized number of recombination events per genoptype. Here, the absolute number of recombination events is divided by the number of analyzed sequences for that particular genotype.
|
|
|
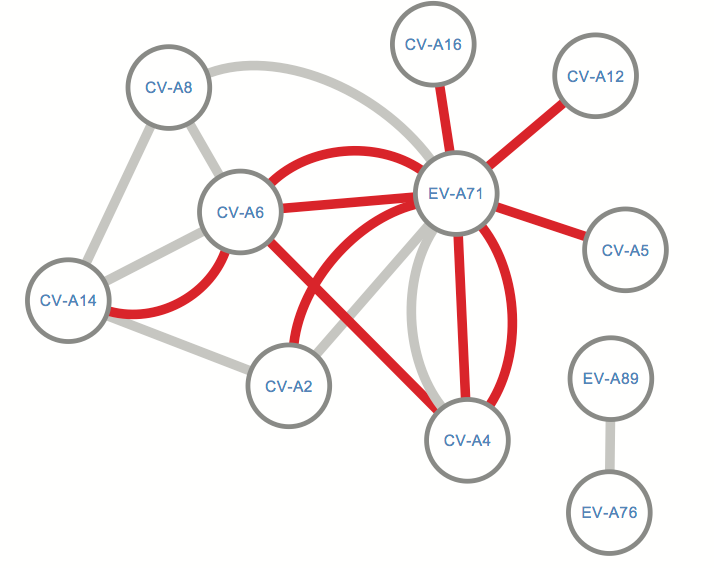
Figure 4. Network of recombination partners for Enterovirus A genotypes. Edges depict events where the recombined sequence fragment within a certain genotype had ≥90% (grey color) or ≥95% (red color) identity with another genotype, based on NCBI BLAST. EV-71 and CV-A6 play a central role as recombination partners.
|
|
|
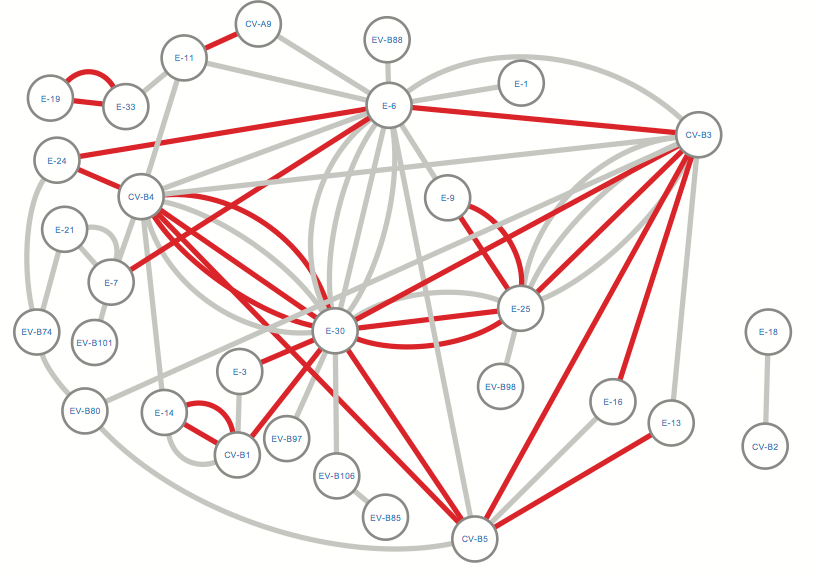
Figure 5. Network of recombination partners for Enterovirus B genotypes. Edges depict events where the recombined sequence fragment within a certain genotype had ≥90% (grey color) or ≥95% (red color) identity with another genotype, based on NCBI BLAST. E30, E-6, E-25, CV-B5, CV-B4 and CV-A9 emerge as prominent recombination partners.
|
|
|
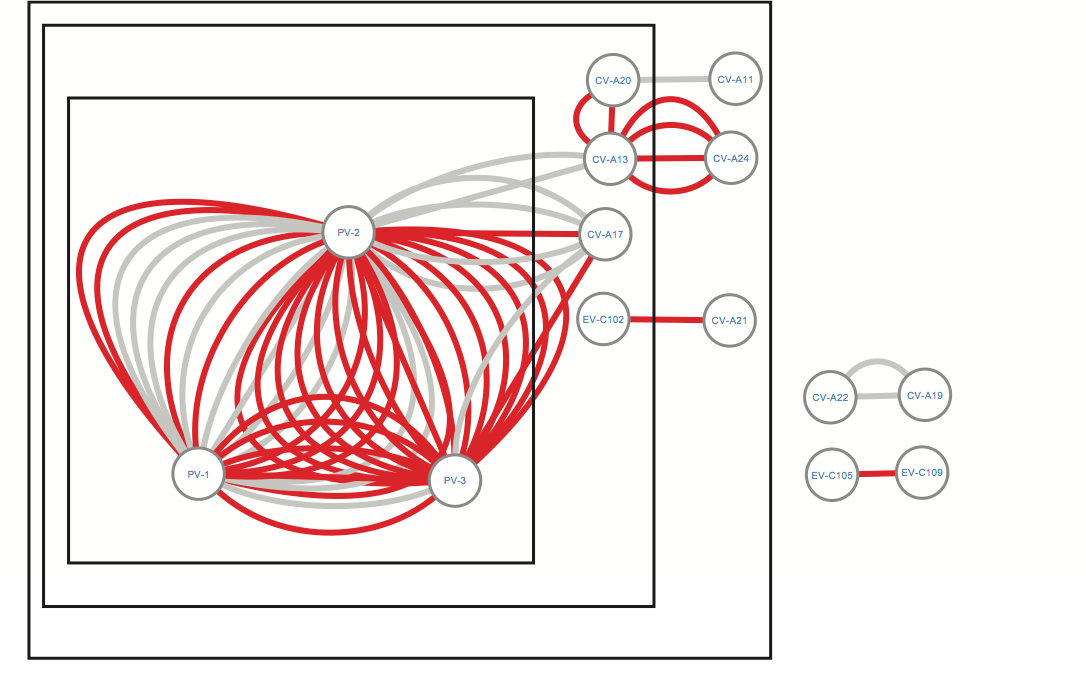
Figure 6. Network of recombination partners for Enterovirus C genotypes. Edges depict events where the recombined sequence fragment within a certain genotype had ≥90% (grey color) or ≥95% (red color) identity with another genotype, based on NCBI BLAST. Boxes group genotypes according to the phylogenetic relatedness of the PV subfamily to the other Enterovirus C subfamilies (see also phylogenetic tree in supplementary file S14). PV2 plays a central role in the exchange of genetic material within the Enterovirus C species.
|