HPV16-Genotyper: a computational tool for risk-assessment, lineage genotyping and recombination detection in HPV16 sequences, based on a large-scale evolutionary analysis
Marios Nikolaidis1,
Dimitris Tsakogiannis2,
Garyfalia Bletsa2,
Dimitris Mossialos3,
Christina Kottaridi4,
Ioannis Iliopoulos5,
Panayotis Markoulatos3,
and Grigoris D. Amoutzias1*
- Bioinformatics Laboratory, Department of Biochemistry and Biotechnology, University of Thessaly, Larissa, 41500, Greece
- Research Center, Hellenic Anticancer Institute, 10680, Athens, Greece
- Microbial Biotechnology-Molecular Bacteriology-Virology Laboratory, Department of Biochemistry and Biotechnology, University of Thessaly, Larissa, 41500, Greece
- Microbiology Laboratory, Department of Biology, Aristotle University of Thessaloniki, Greece
- Department of Medicine, University of Crete, Heraklion 71003, Greece.
The HPV16-Genotyper computational tool
Based on our HPV16 evolutionary analyses, we developed a computational tool in Biopython that automates the entire process and performs genotyping, quality control of genome assembly, detection of recombination events and detection of cancer-related SNPs (see Figure 1 for a workflow of the software).
The software was tested on 180 representative genomes and was validated for proper performance. The entire analysis took 16 minutes on a personal Linux (Ubuntu 20) laptop with 8 cores (2.4 GHz).
The software and the accompanying help video can be downloaded in the links below:
Download the help video that explains the software installation and usageDownload the HPV16-genotyper for Windows 10
Download the HPV16-genotyper for Ubuntu 20
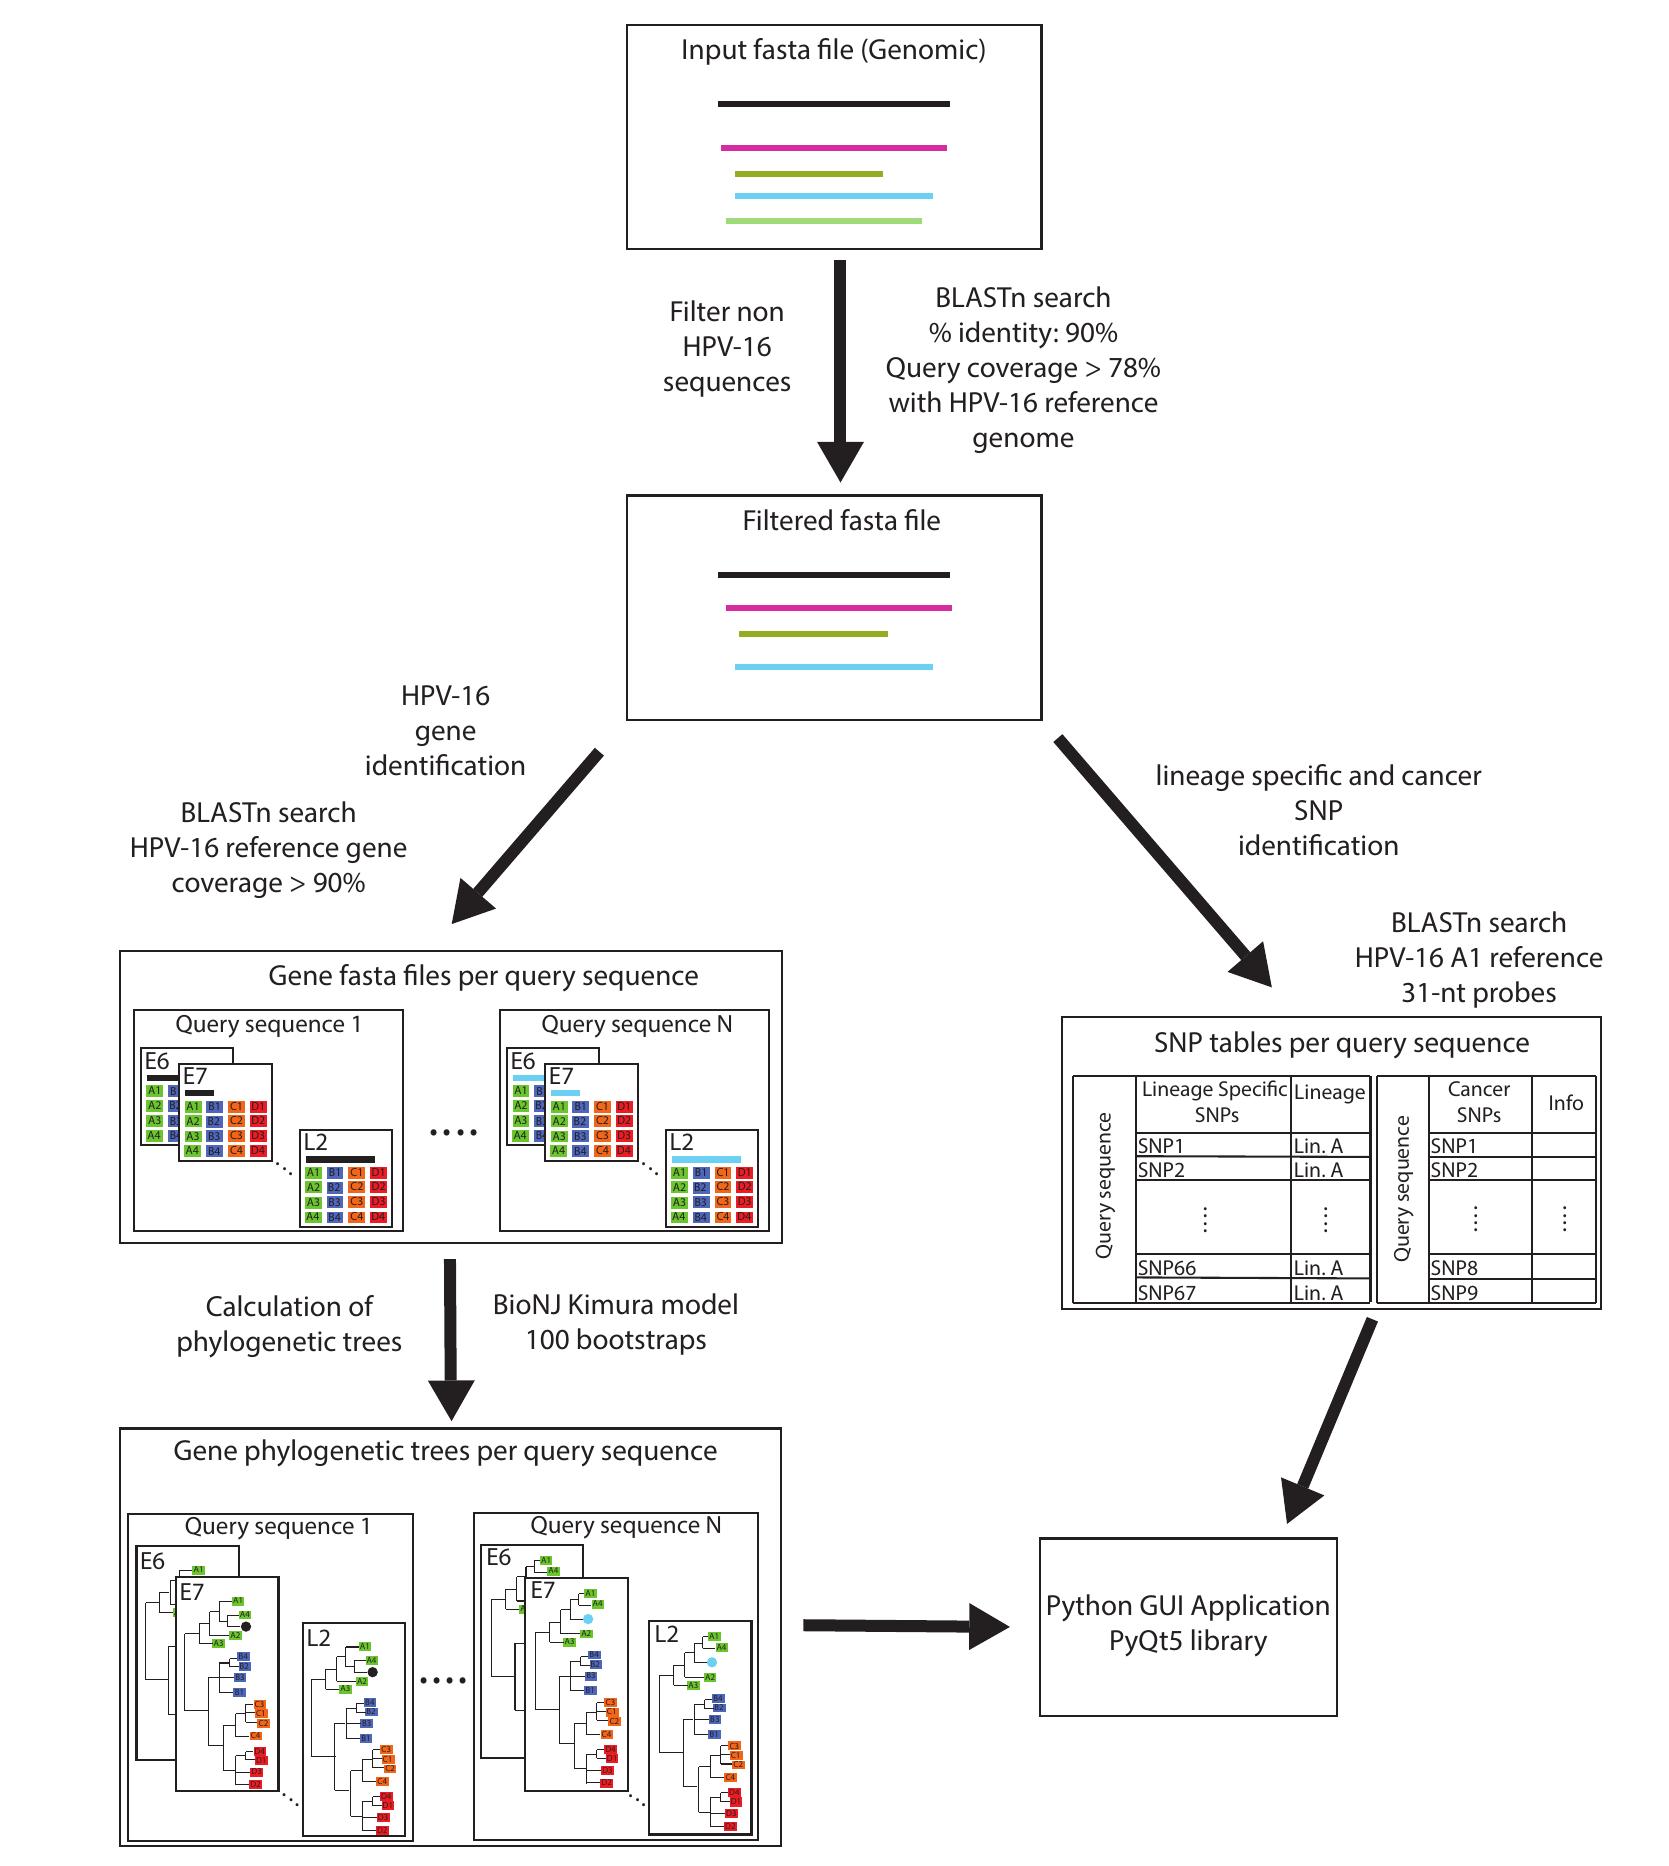
More specifically, the software accepts sequences in FASTA format and first tries to determine which of them are HPV16 sequences or not (based on the 90% nucleotide identity criterion). Next, the software scans each HPV16 sequence for the presence of any of the 67 lineage-specific SNPs. The results are depicted in sections A7 and A8 of Figure 2. From this analysis, the user can determine in which clade/lineage the sequence belongs to. In addition, if the majority of SNPs belong to a certain clade/lineage, but there also exists a number of SNPs from another clade/lineage that also tend to cluster together, this is a strong indication of interlineage recombination. However, if the sequence shows a randomly mixed pattern of SNPs from different lineages, this may be a sign of genome mis-assembly, due to infection from more than one lineages. Thus, this analysis also functions as a quality control of the assembled sequence. Afterwards, HPV16 sequences are analyzed with BlastN in order to determine the boundaries of each gene. Furthermore, BlastN determines in which of the 16 sublineages each gene belongs to. This result is depicted in section A10 of Figure 2 and can be used as a good indication in which lineage and sublineage the sequence belongs to and whether the sequence could be an interlineage recombinant or not. Next, the genes of the analyzed HPV16 sequences undergo Neighbor Joining phylogenetic analysis together with the homologous genes from each of the 16 reference sublineages. The results of the phylogenetic analyses are visualized with the ETE3 package (see section B of Figure 2) by pressing the corresponding button (in section A11 in Figure 2). ETE3 allows the user to perform many editing functions upon the phylogenetic tree, such as rerooting, ladderizing, clade swapping etc. Therefore, this phylogenetic analysis of each gene separately is probably the best method to determine the lineage and sublineage of a sequence and whether it's a recombinant (or even assembly artifact), based on any observed phylogenetic incongruence. The software also decides whether a sequence is a recombinant or not based on both the BlastN and lineage-specific SNPs. More specifically, a sequence identified as a potential recombinant needs to have genes from a different lineage. Simultaneously, the sequence needs to have three or more consecutive SNPs from another clade/lineage. The potential recombinants can be displayed by pressing the corresponding button (in section A4 of Figure 2). In addition, a potential recombinant may undergo Similarity Plot analysis (see section C of Figure 2) by pressing the corresponding button (see section A12 of Figure 2). Finally, the software scans each HPV16 sequence for the presence of any of the 9 SNPs that are known to be associated with an increased risk of cancer. These results are depicted in the corresponding table (see section A5 of Figure 2) whereas a description/annotation of each cancer-related SNP together with its associated literature citation/s is depicted in the corresponding box (see section A6 of Figure 2).
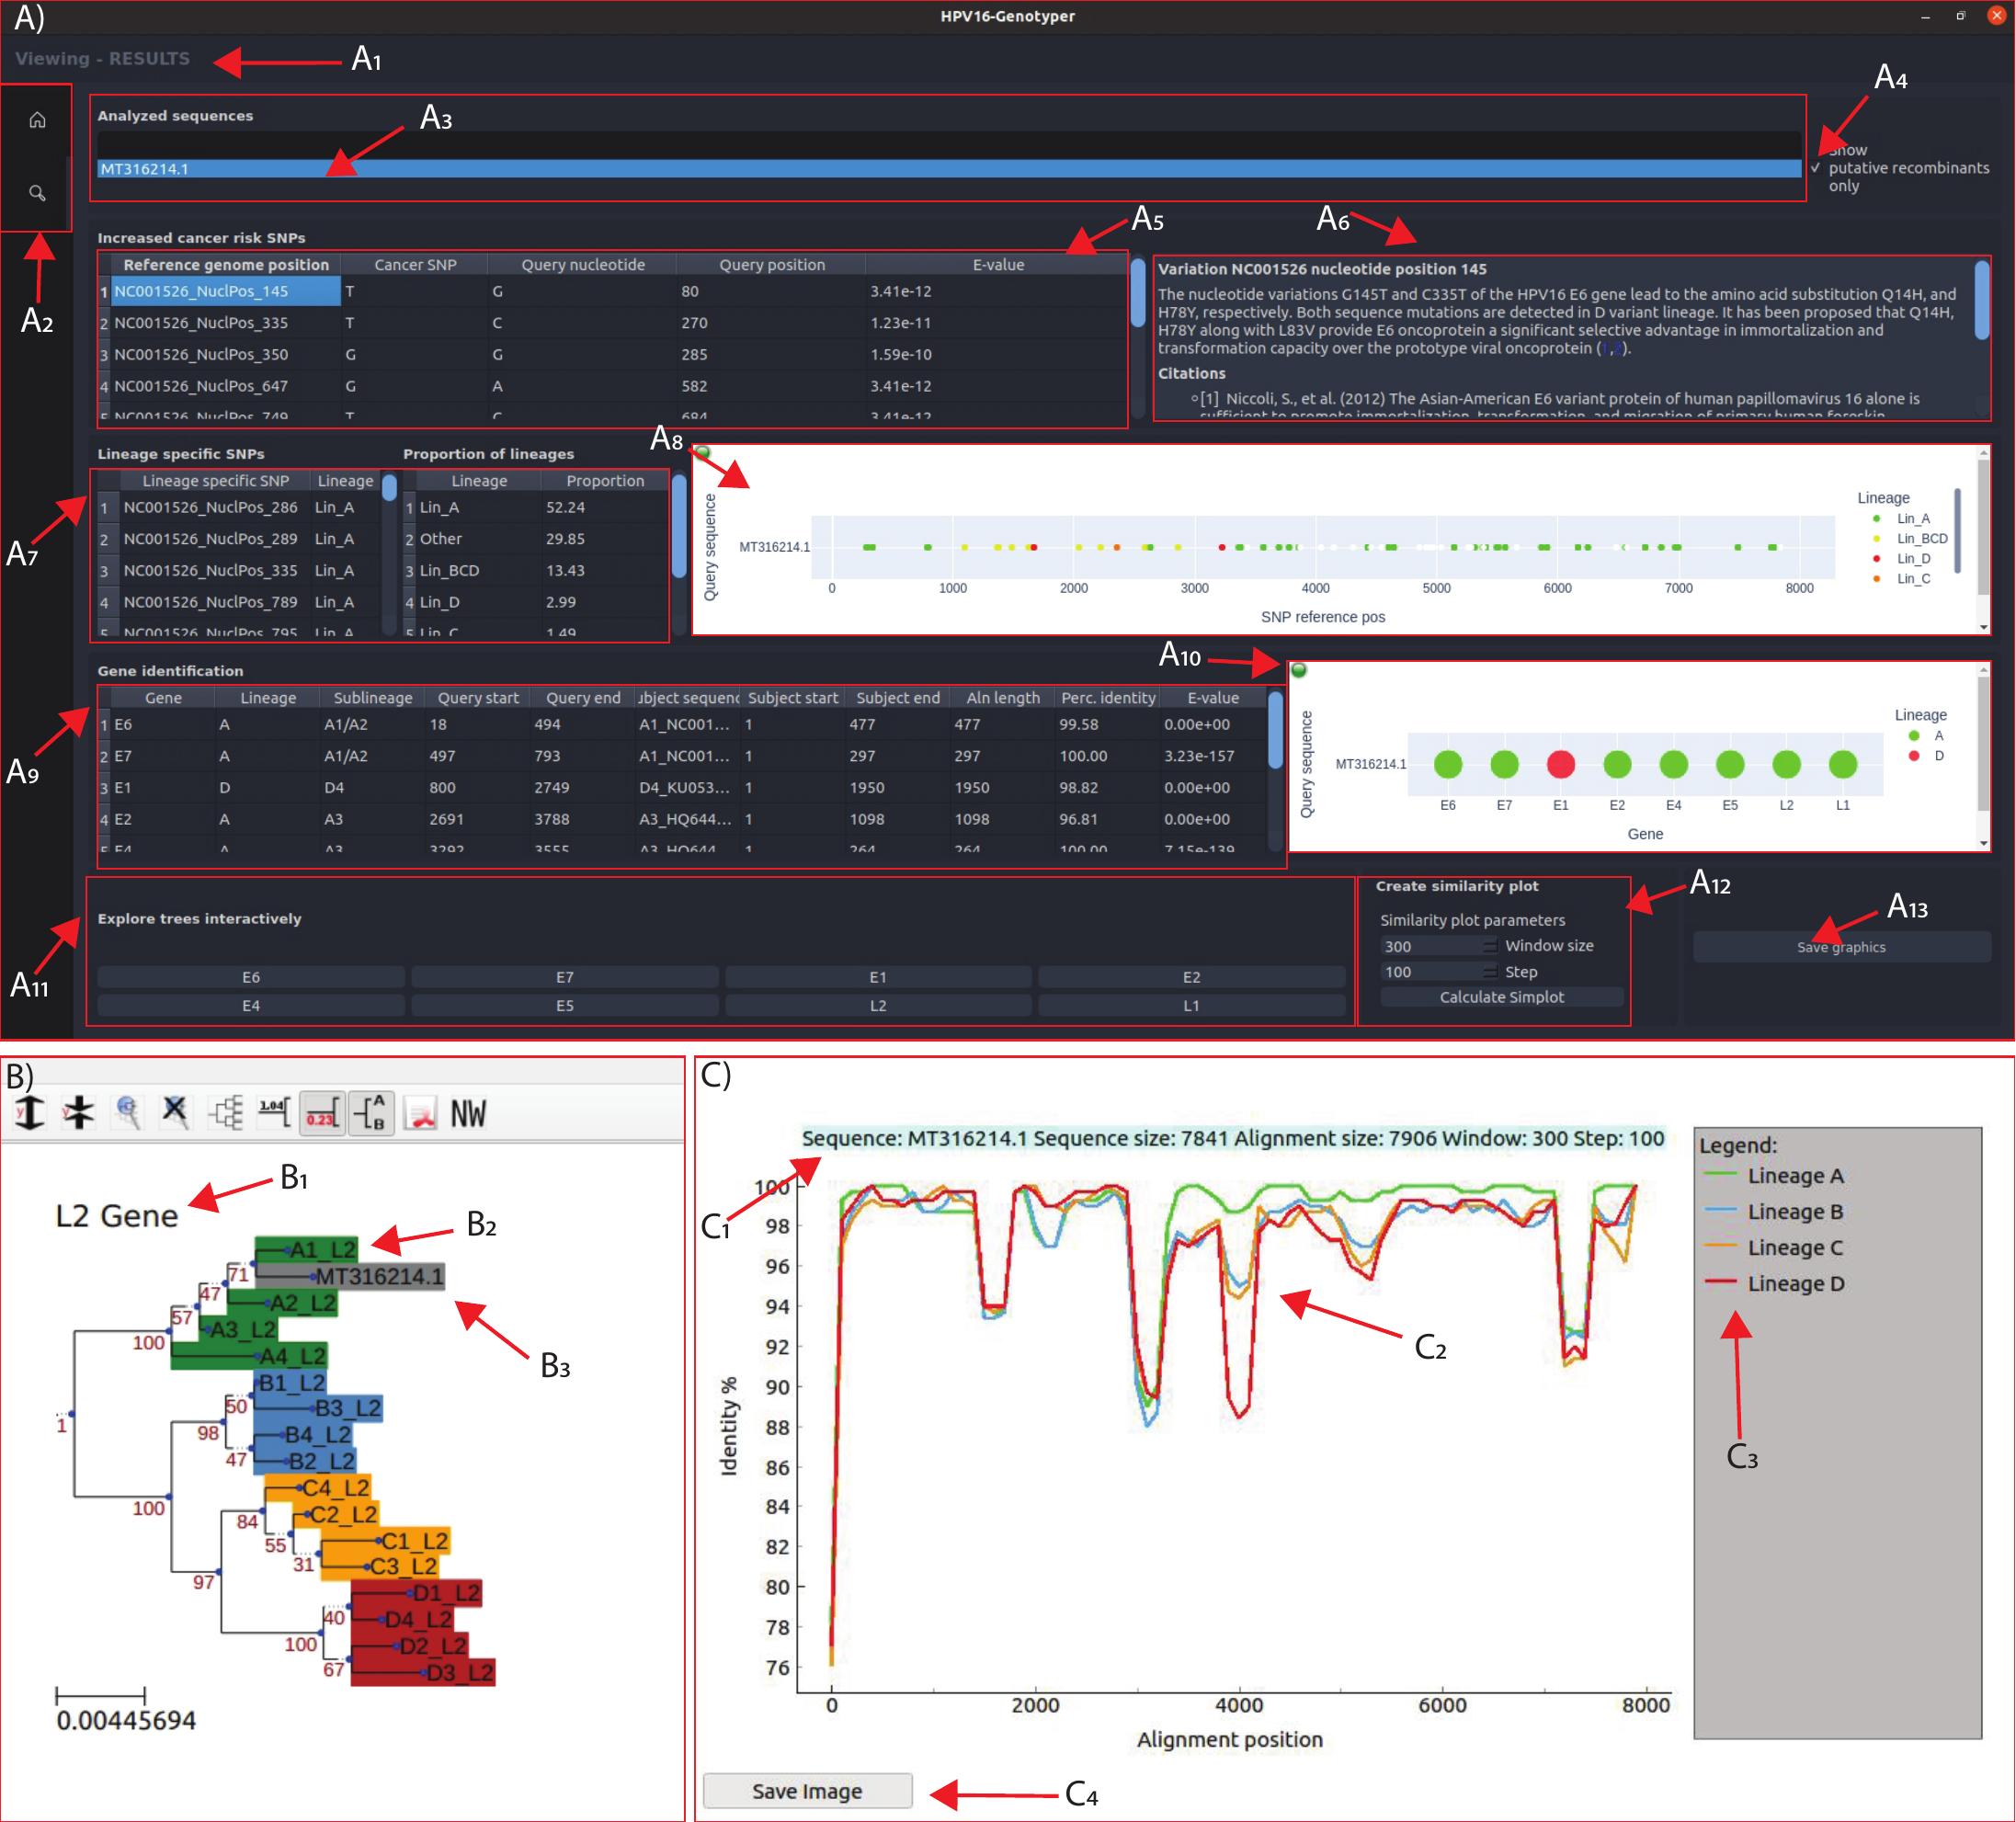
Figure 2. The HPV16-Genotyper tool GUI components (A-C)
The first component (panel A) is the main results page. A1 is the status bar, where the user gets information about the currently displayed page. A2 are the total pages available (Home and Results). The first frame of the results page contains A3, a list of all the analyzed sequences. By double clicking the name of a sequence, the page updates with the corresponding information. By checking the button A4, the list displays only the putative recombinants identified in the analysis. The next frame contains information about 9 SNPs associated with increased risk of cancer (A5) and clicking on any of the identified SNPs displays information (A6) about that specific SNP. A7 shows the lineage specific SNPs identified in the selected sequence and this information is summarized in graph A8. BLAST results for each gene are shown in table A9 and summarized in graph A10. In the frame A11 the user has the option to view the phylogenetic tree for each gene. In case that the selected sequence does not contain the selected gene, an error message will be displayed. The A12 frame gives the option to create the similarity plot of the selected sequence. A13 saves A8 and A10 on the output directory. Panel B shows an example interactive tree visualization, where B1 is the gene label, B2 shows the different reference sequences which are colored based on their lineage and B3 shows the selected sequence which will always be colored gray. Panel C shows an example similarity plot window. C1 is the plot description, C2 is the similarity plot, C3 is the plot legend and C4 is a button that can save the page in JPG format.