Comparative Analysis of the Core Proteomes among the Pseudomonas
Major Evolutionary Groups Reveals Species-Specific Adaptations for
Pseudomonas aeruginosa and Pseudomonas chlororaphis
The Pseudomonas genus includes many species living in
diverse environments and hosts. It is important to understand
which are the major evolutionary groups and what are the
genomic/proteomic components they have in common or are unique.
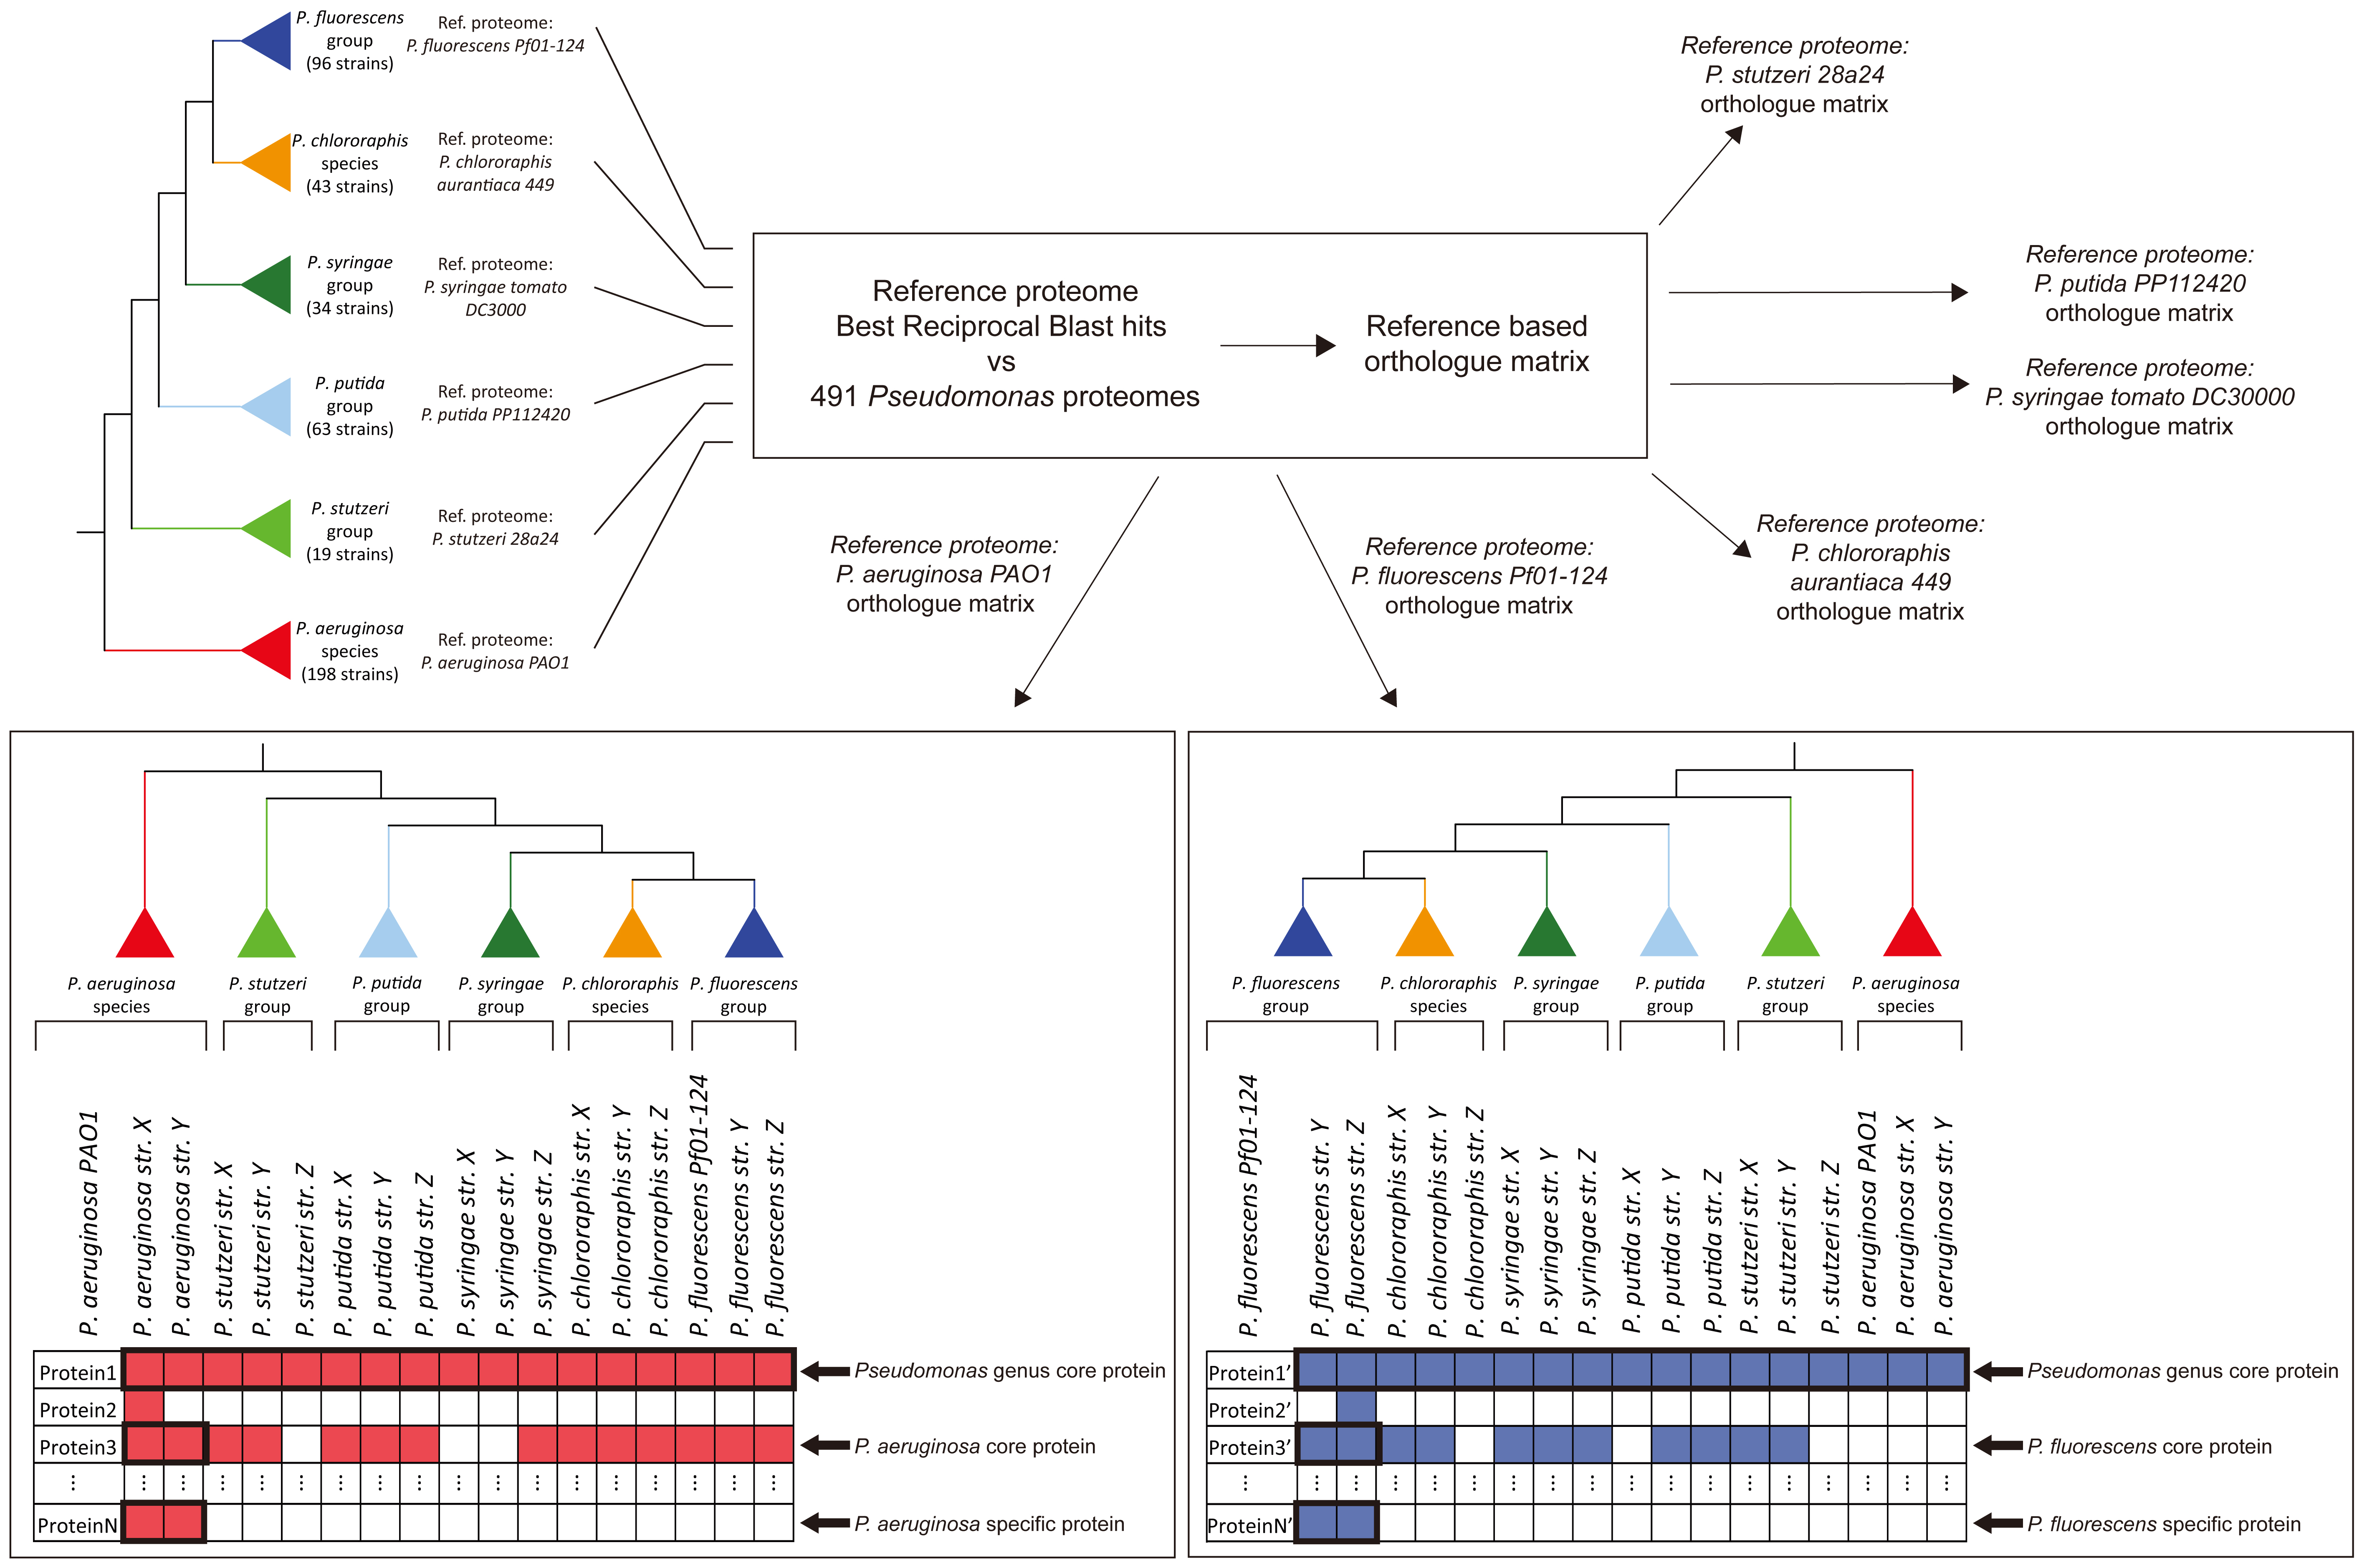
Towards this goal, we analyzed 494 complete
Pseudomonas proteomes and identified 297 core-orthologues.
The subsequent phylogenomic analysis revealed two well-defined
species (Pseudomonas aeruginosa and
Pseudomonas chlororaphis) and four wider phylogenetic
groups (Pseudomonas fluorescens,
Pseudomonas stutzeri, Pseudomonas syringae,Pseudomonas putida) with a sufficient number of proteomes.
As expected, the genus-level core proteome was highly enriched for
proteins involved in metabolism, translation, and transcription.
In addition, between 39–70% of the core proteins in each group had
a significant presence in each of all the other groups.
Group-specific core proteins were also identified, with
P. aeruginosa having the highest number of these and
P. fluorescens having none. We identified several
P. aeruginosa-specific core proteins (such as CntL,
CntM, PlcB, Acp1, MucE, SrfA,
Tse1, Tsi2, Tse3, and EsrC) that are
known to play an important role in its pathogenicity. Finally, a
holin family bacteriocin and a mitomycin-like biosynthetic protein
were found to be core-specific for P. cholororaphis and we
hypothesize that these proteins may confer a competitive advantage
against other root-colonizers.
Graphical abstract
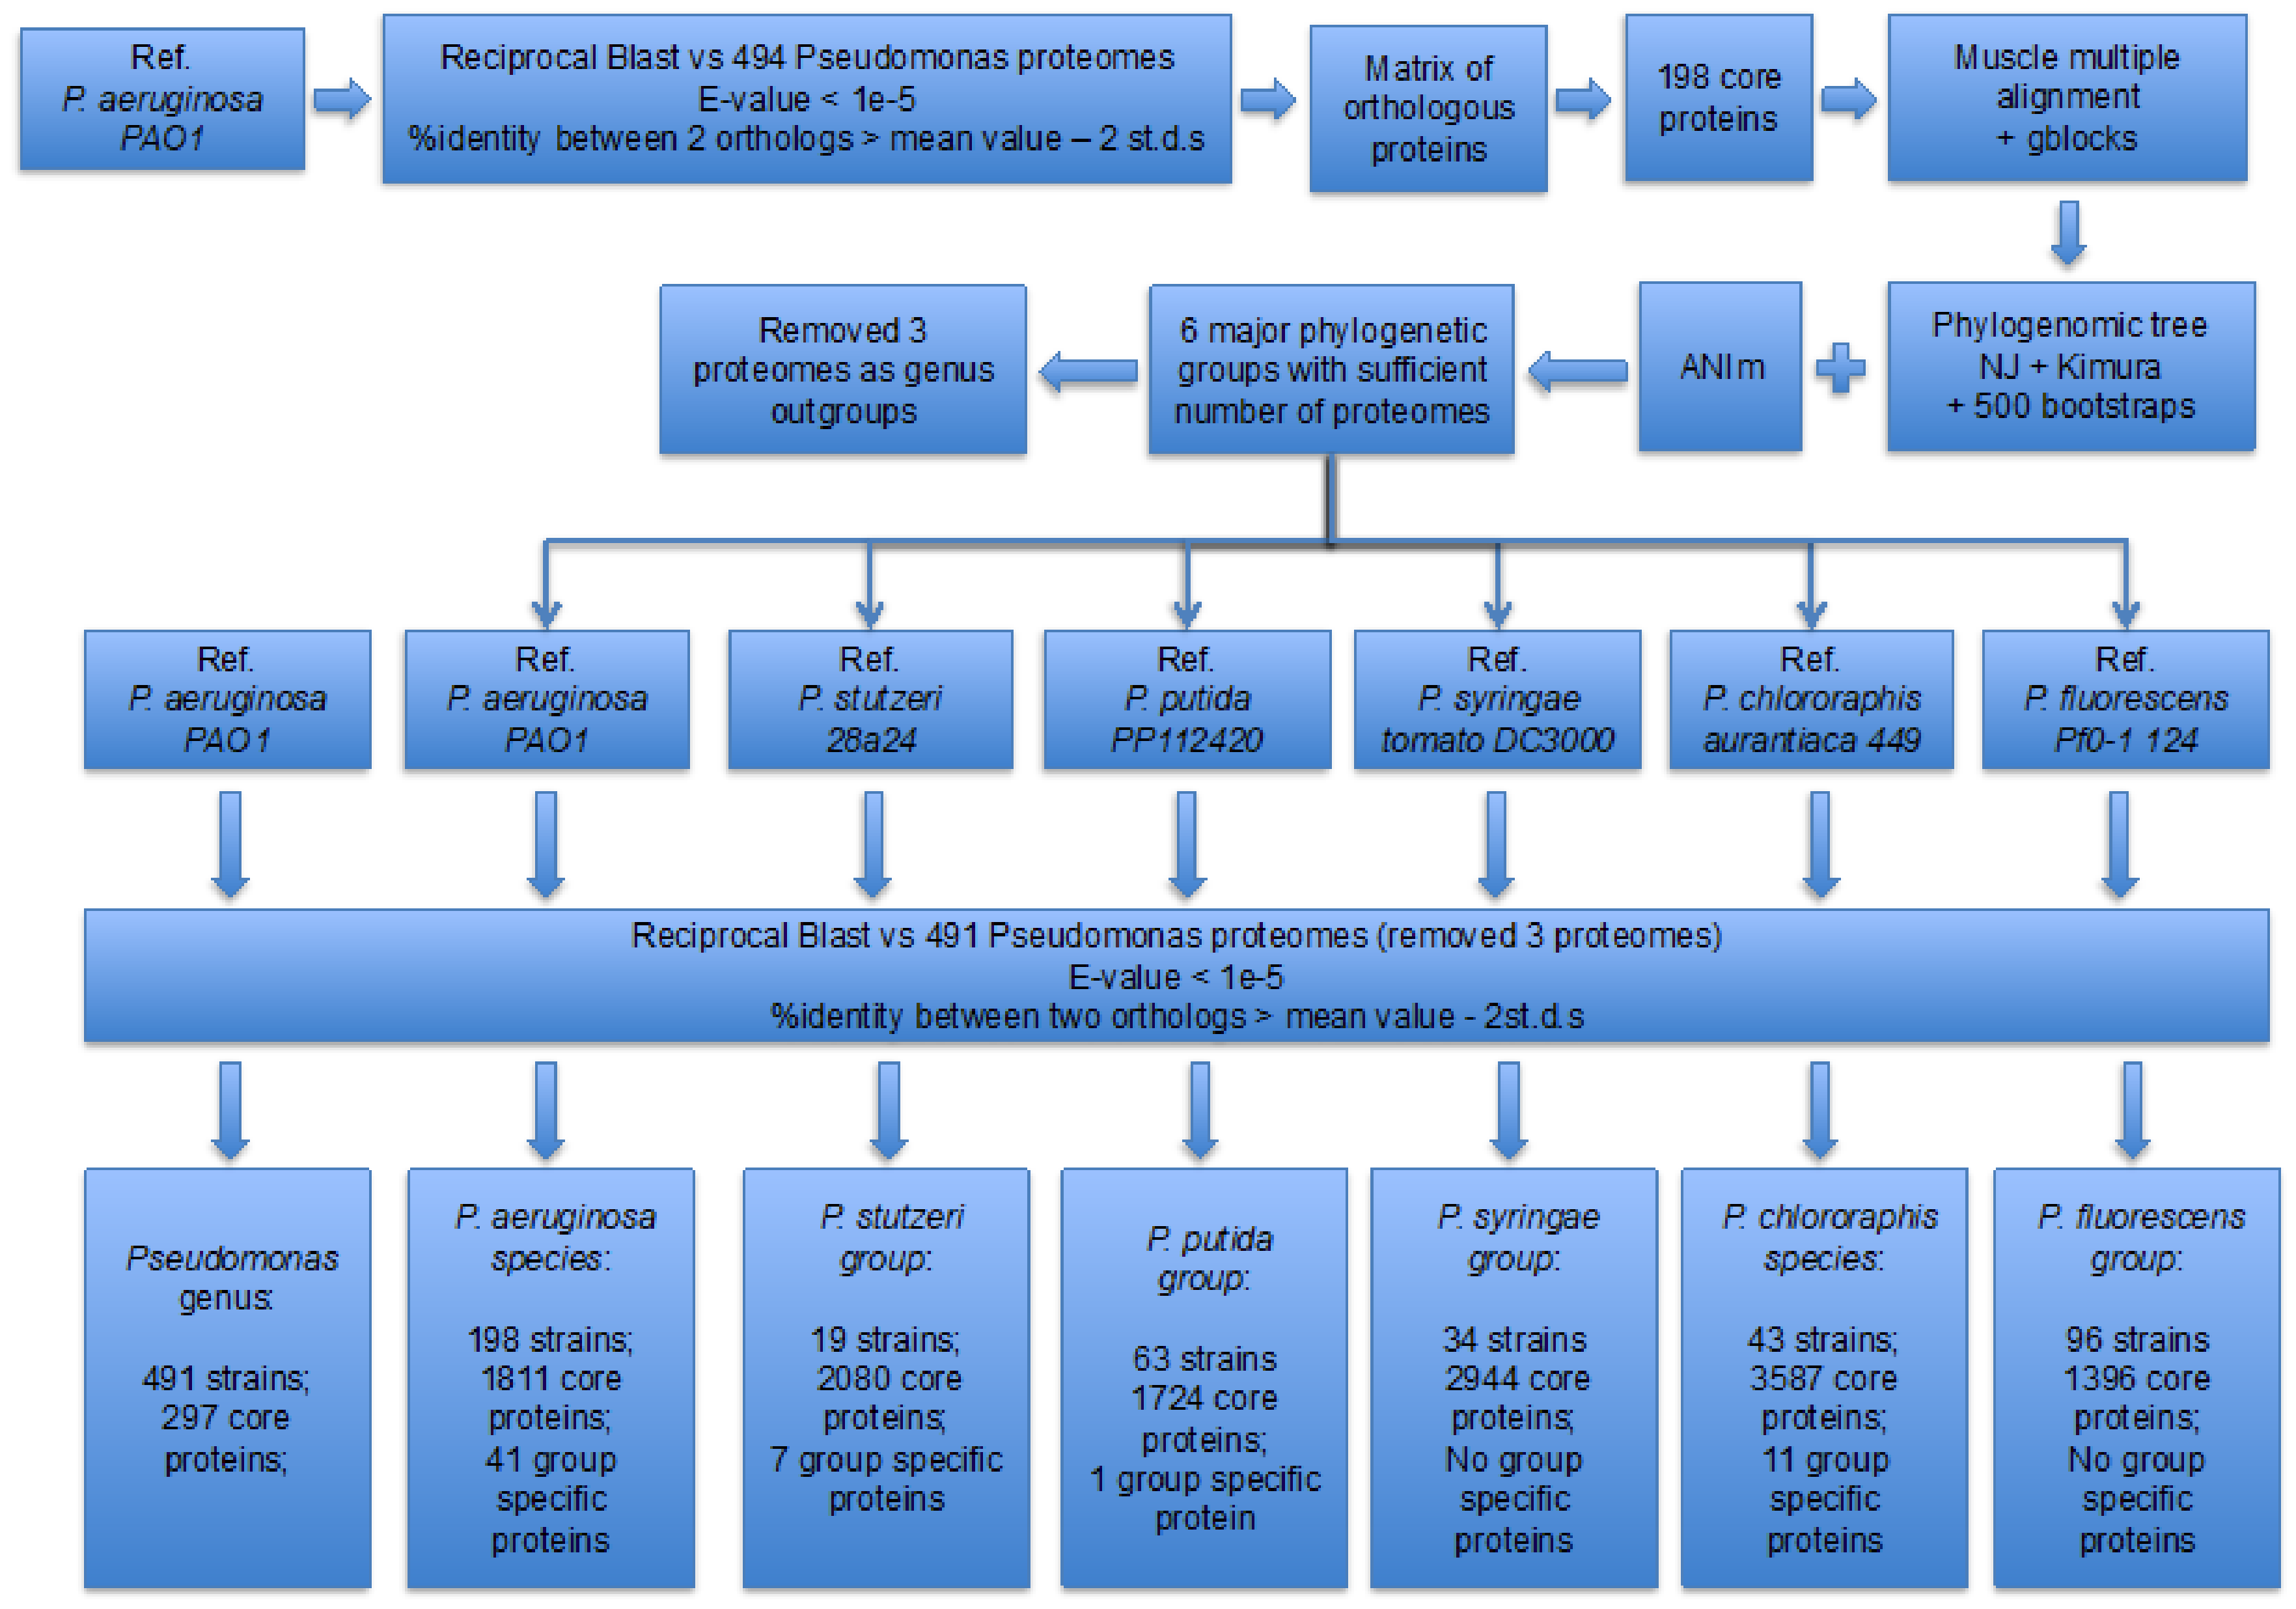
Figure 1. Workflow of the phylogenomic and core proteome analyses.
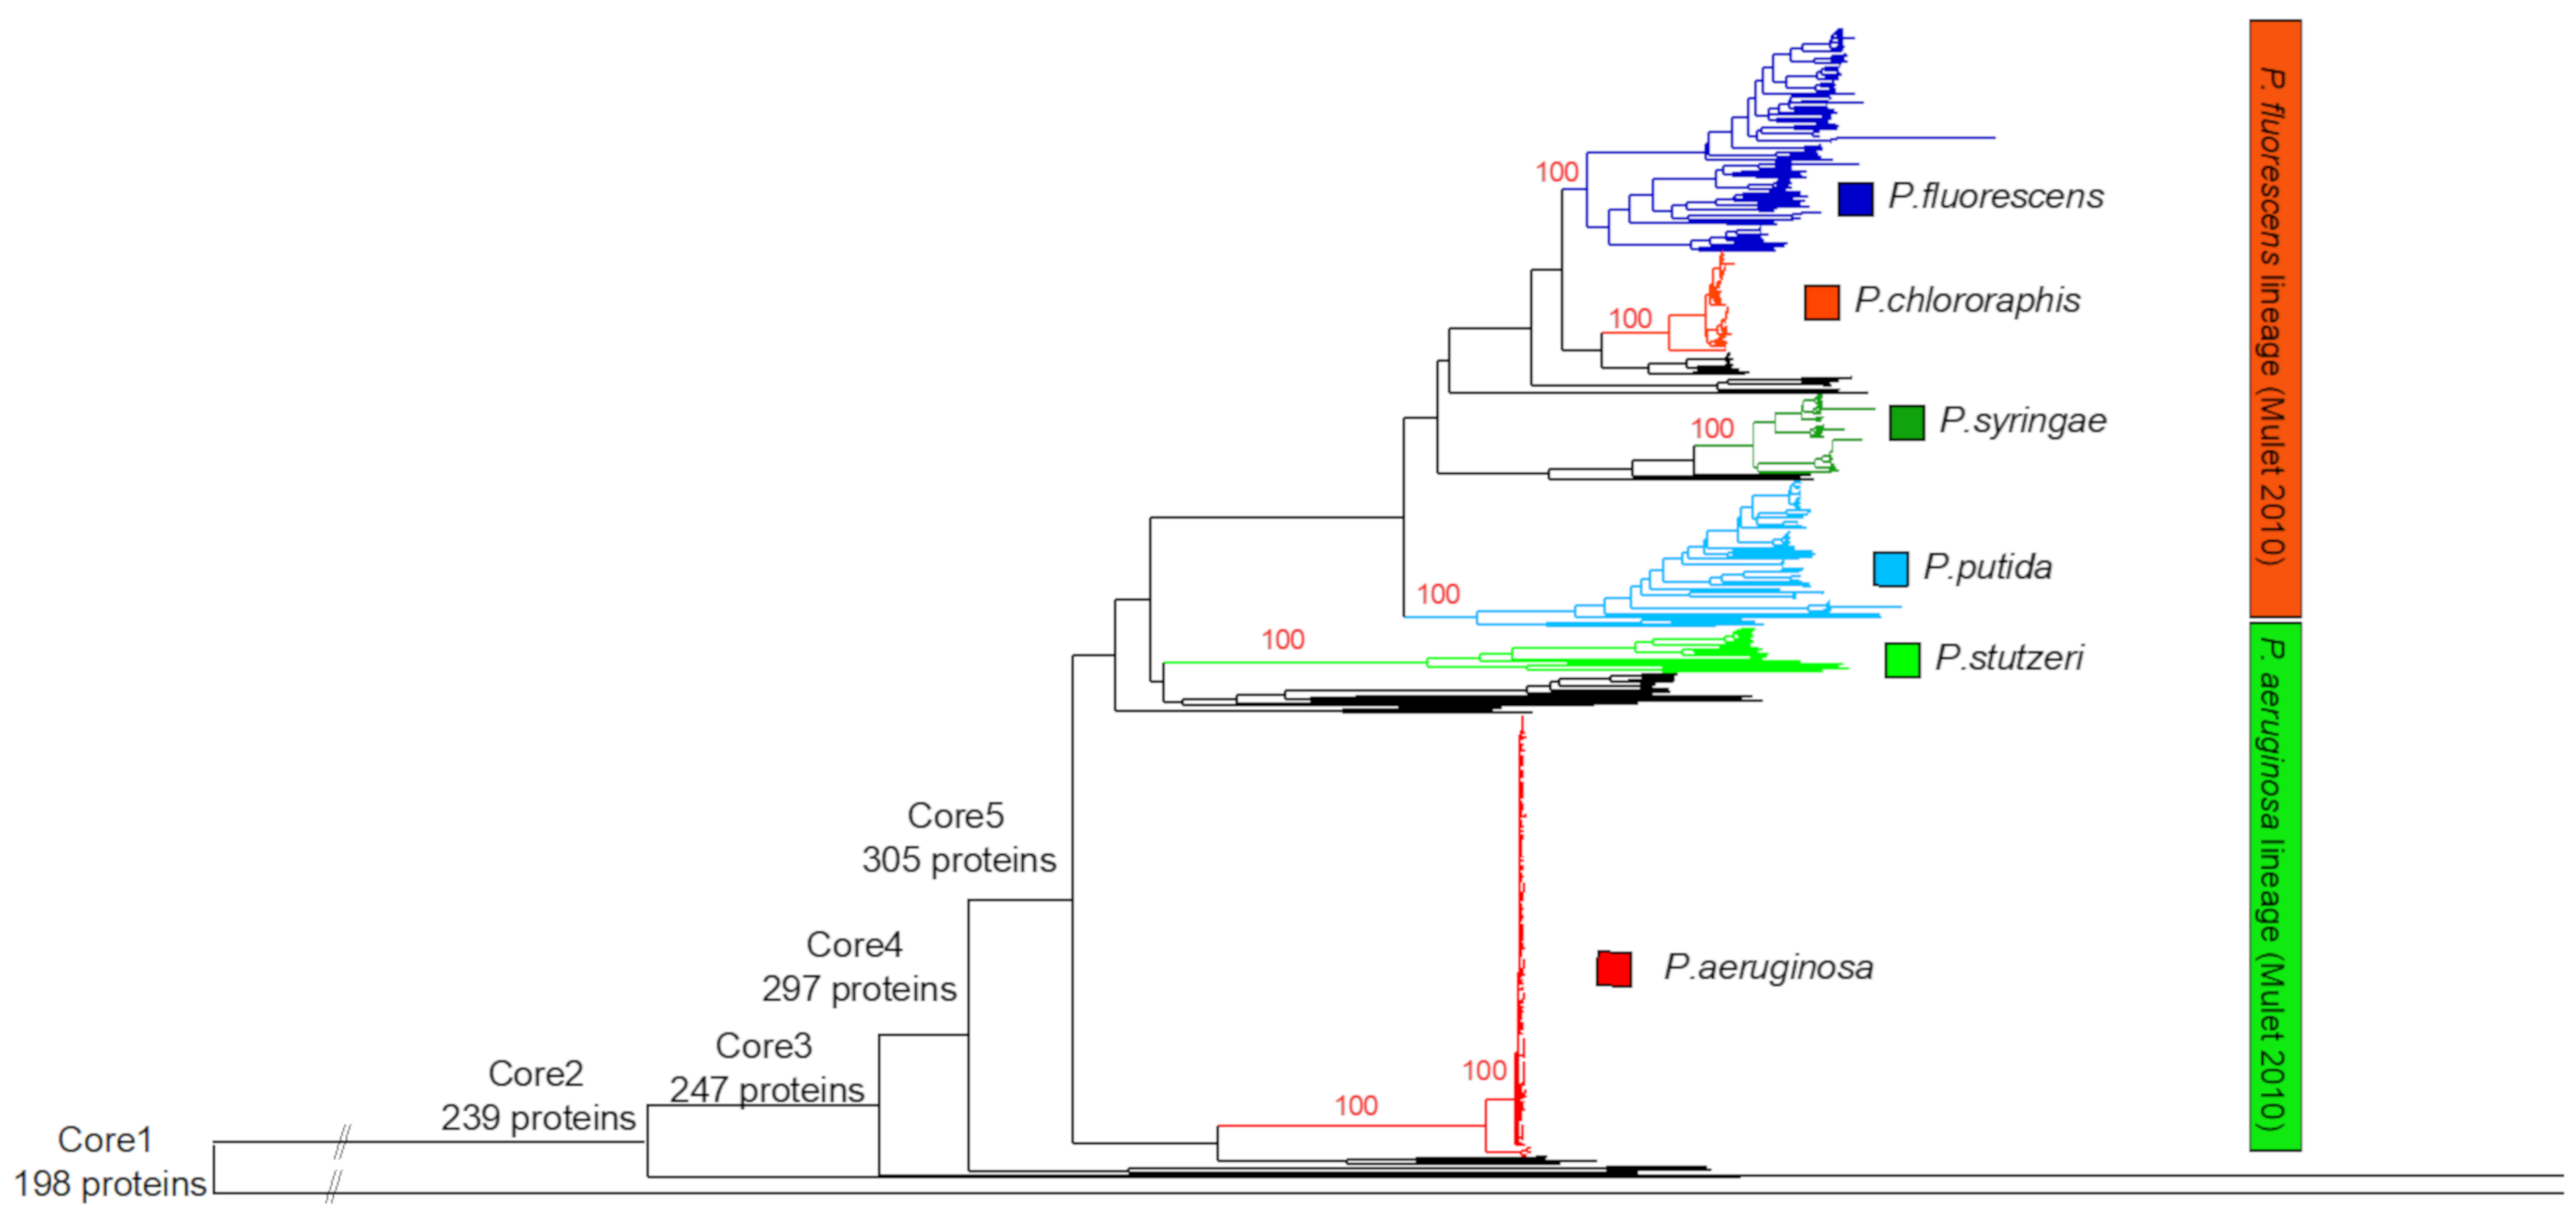
Figure 2. The phylogenomic neighbor-joining tree of the 494
complete proteomes. The tree was based on 198 core proteins (core
set 1), using the Kimura model and 500 bootstrap values. The
various genus core sets are indicated on the tree.
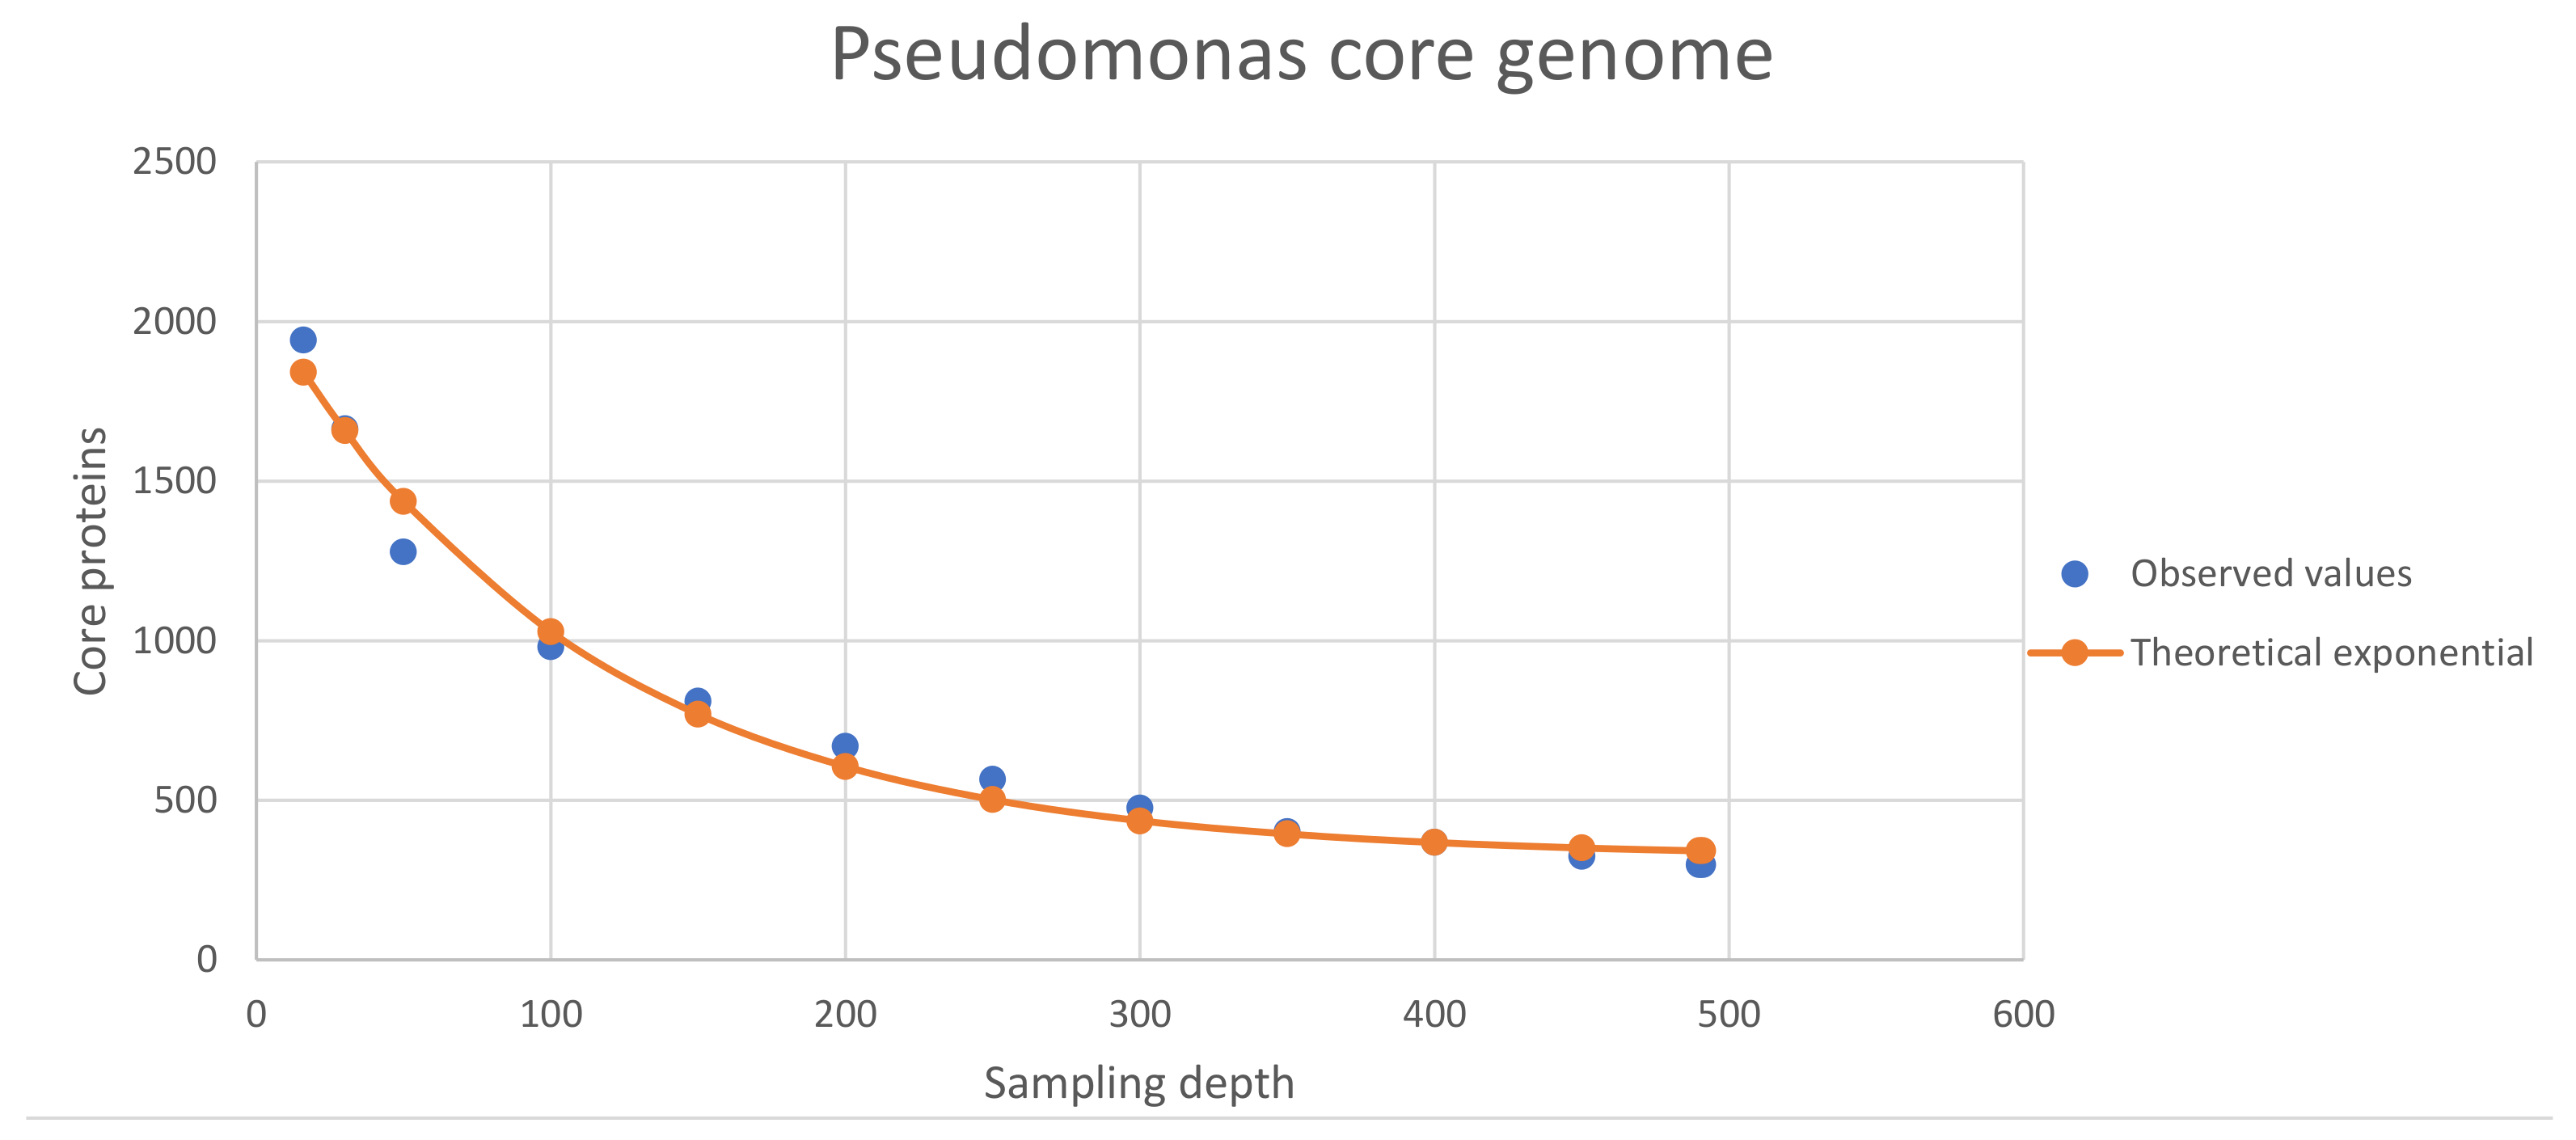
Figure 3. The Pseudomonas genus core proteome, depending on the
sampling depth (i.e., number of proteomes analyzed).
A Comparative Analysis of the Core Proteomes within and among the
Bacillus subtilis and Bacillus cereus Evolutionary
Groups Reveals the Patterns of Lineage- and Species-Specific
Adaptations
By integrating phylogenomic and comparative analyses of 1104
high-quality genome sequences, we identify the core proteins and
the lineage-specific fingerprint proteins of the various
evolutionary clusters (clades/groups/species) of the
Bacillus genus. As fingerprints, we denote those core
proteins of a certain lineage that are present only in that
particular lineage and absent in any other
Bacillus lineage. Thus, these lineage-specific fingerprints
are expected to be involved in particular adaptations of that
lineage. Intriguingly, with a few notable exceptions, the majority
of the Bacillus species demonstrate a rather low number of
species-specific fingerprints, with the majority of them being of
unknown function. Therefore, species-specific adaptations are
mostly attributed to highly unstable (in evolutionary terms)
accessory proteomes and possibly to changes at the gene regulation
level. A series of comparative analyses consistently demonstrated
that the progenitor of the Cereus Clade underwent an extensive
genomic expansion of chromosomal protein-coding genes. In
addition, the majority (76–82%) of the B. subtilis proteins
that are essential or play a significant role in sporulation have
close homologs in most species of both the Subtilis and the Cereus
Clades. Finally, the identification of lineage-specific
fingerprints by this study may allow for the future development of
highly specific vaccines, therapeutic molecules, or rapid and
low-cost molecular tests for species identification.
Figure 1. The phylogenomic maximum likelihood tree (IQ-Tree2) of
the 1104 Bacillus proteomes. The tree was based on 114 core
proteins and 20,041 variable sites, using the LG + I + F + G4
model and aLRT. For ease of visualization, the entire Subtilis and
Cereus Clades are collapsed. Next to each leaf of the tree, the
chromosome size, and the number of all chromosomally encoded
proteins are given.
Figure 2. Phylogenomic ML tree (IQ-Tree2-Q.Plant + I + F +
G4-aLRT) of the Subtilis Clade based on 457 core
protein-orthologous groups from 634 proteomes. For ease of
visualization, certain evolutionary clusters have been collapsed.
The full tree is available as Supplementary Figure S2. Next to the
species name, in parentheses, is the number of complete genomes
that are available and, on their right, is the number of genomes
used in the normalized dataset. Further to the right of the
species names and at the common ancestor of a lineage, with blue
and red colors we denote the number of core and relaxed/strict
fingerprint proteins for each lineage (based on the normalized
dataset).
Figure 3. Phylogenomic ML tree (QTree2-Q.Plant + I + F + G4-aLRT)
of the Cereus Clade, based on 812 core protein-orthologous groups
from 445 proteomes. For ease of visualization, certain
evolutionary clusters have been collapsed. The full tree is
available as Supplementary Figure S3. Next to the species name, in
parentheses, is the number of complete genomes that are available
and, on their right, is the number of genomes used in the
normalized dataset. Further to the right of the species names and
at the common ancestor of a lineage, we denote with blue and red
colors the number of core and (relaxed/strict) fingerprint
proteins for each lineage (based on the normalized dataset).
Figure 4. Boxplot of the total number of proteins (y-axis) for
every available strain (dot—each genome) of a species (x-axis) and
its normalized core proteome (green bar).
Figure 5. (A) The phylogenetic distribution of core
proteins of the Subtilis Clade in the species of the Cereus Clade.
(B) The phylogenetic distribution of core proteins of the
Cereus Clade in the species of the Subtilis Clade. The bins on the
x-axis correspond to the number of species (in the other Clade),
while the y-axis corresponds to the absolute number of core
proteins (for that bin). For example, the first graph of Figure 5A
shows that 1072 of the core proteins of the Subtilis Clade are
also present in 16–17 species of the Cereus Clade. The ratio of
the low-presence to high presence bin is shown in the box at the
top of the graph. Stars identify any ratio whose difference from
the background (in all categories) is statistically significant
(based on the hypergeometric test; p-value < 0.05).
Figure 6. The phylogenetic distribution pattern of: (A) 155
B. subtilis proteins important for sporulation; (B) 256
proteins that are essential in B. subtilis. Presence of a close
homolog in a given species of the Subtilis and Cereus Clades was
determined based on 50% amino acid identity over 50% of the
protein’s length. The clustering of proteins (based on their
distribution) was performed with the average Euclidean distance,
within the seaborn.clustermap python package. A more detailed view
of the cluster-heatmaps (including the individual gene names and
species) is available in Supplementary Figures S4 and S5. Each row
corresponds to a gene and each column corresponds to a certain
species. The color in the heatmap corresponds to the % presence
(how many strains of the species) of that gene in that certain
species.
A panoramic view of the genomic landscape of the genus
Streptomyces
We delineate the evolutionary plasticity of the ecologically and
biotechnologically important genus
Streptomyces, by analysing the genomes of 213 species.
Streptomycetes genomes demonstrate high levels of internal
homology, whereas the genome of their last common ancestor was
already complex. Importantly, we identify the species-specific
fingerprint proteins that characterize each species. Even among
closely related species, we observed high interspecies variability
of chromosomal protein-coding genes, species-level core genes,
accessory genes and fingerprints. Notably, secondary metabolite
biosynthetic gene clusters (smBGCs), carbohydrate-active enzymes
(CAZymes) and protein-coding genes bearing the rare TTA codon
demonstrate high intraspecies and interspecies variability, which
emphasizes the need for strain-specific genomic mining. Highly
conserved genes, such as those specifying genus-level core
proteins, tend to occur in the central region of the chromosome,
whereas those encoding proteins with evolutionarily volatile
species-level fingerprints, smBGCs, CAZymes and TTA-codon- bearing
genes are often found towards the ends of the linear chromosome.
Thus, the chromosomal arms emerge as the part of the genome that
is mainly responsible for rapid adaptation at the species and
strain level. Finally, we observed a moderate, but statistically
significant, correlation between the total number of CAZymes and
three categories of smBGCs (siderophores, e- Polylysin and type
III lanthipeptides) that are related to competition among
bacteria.
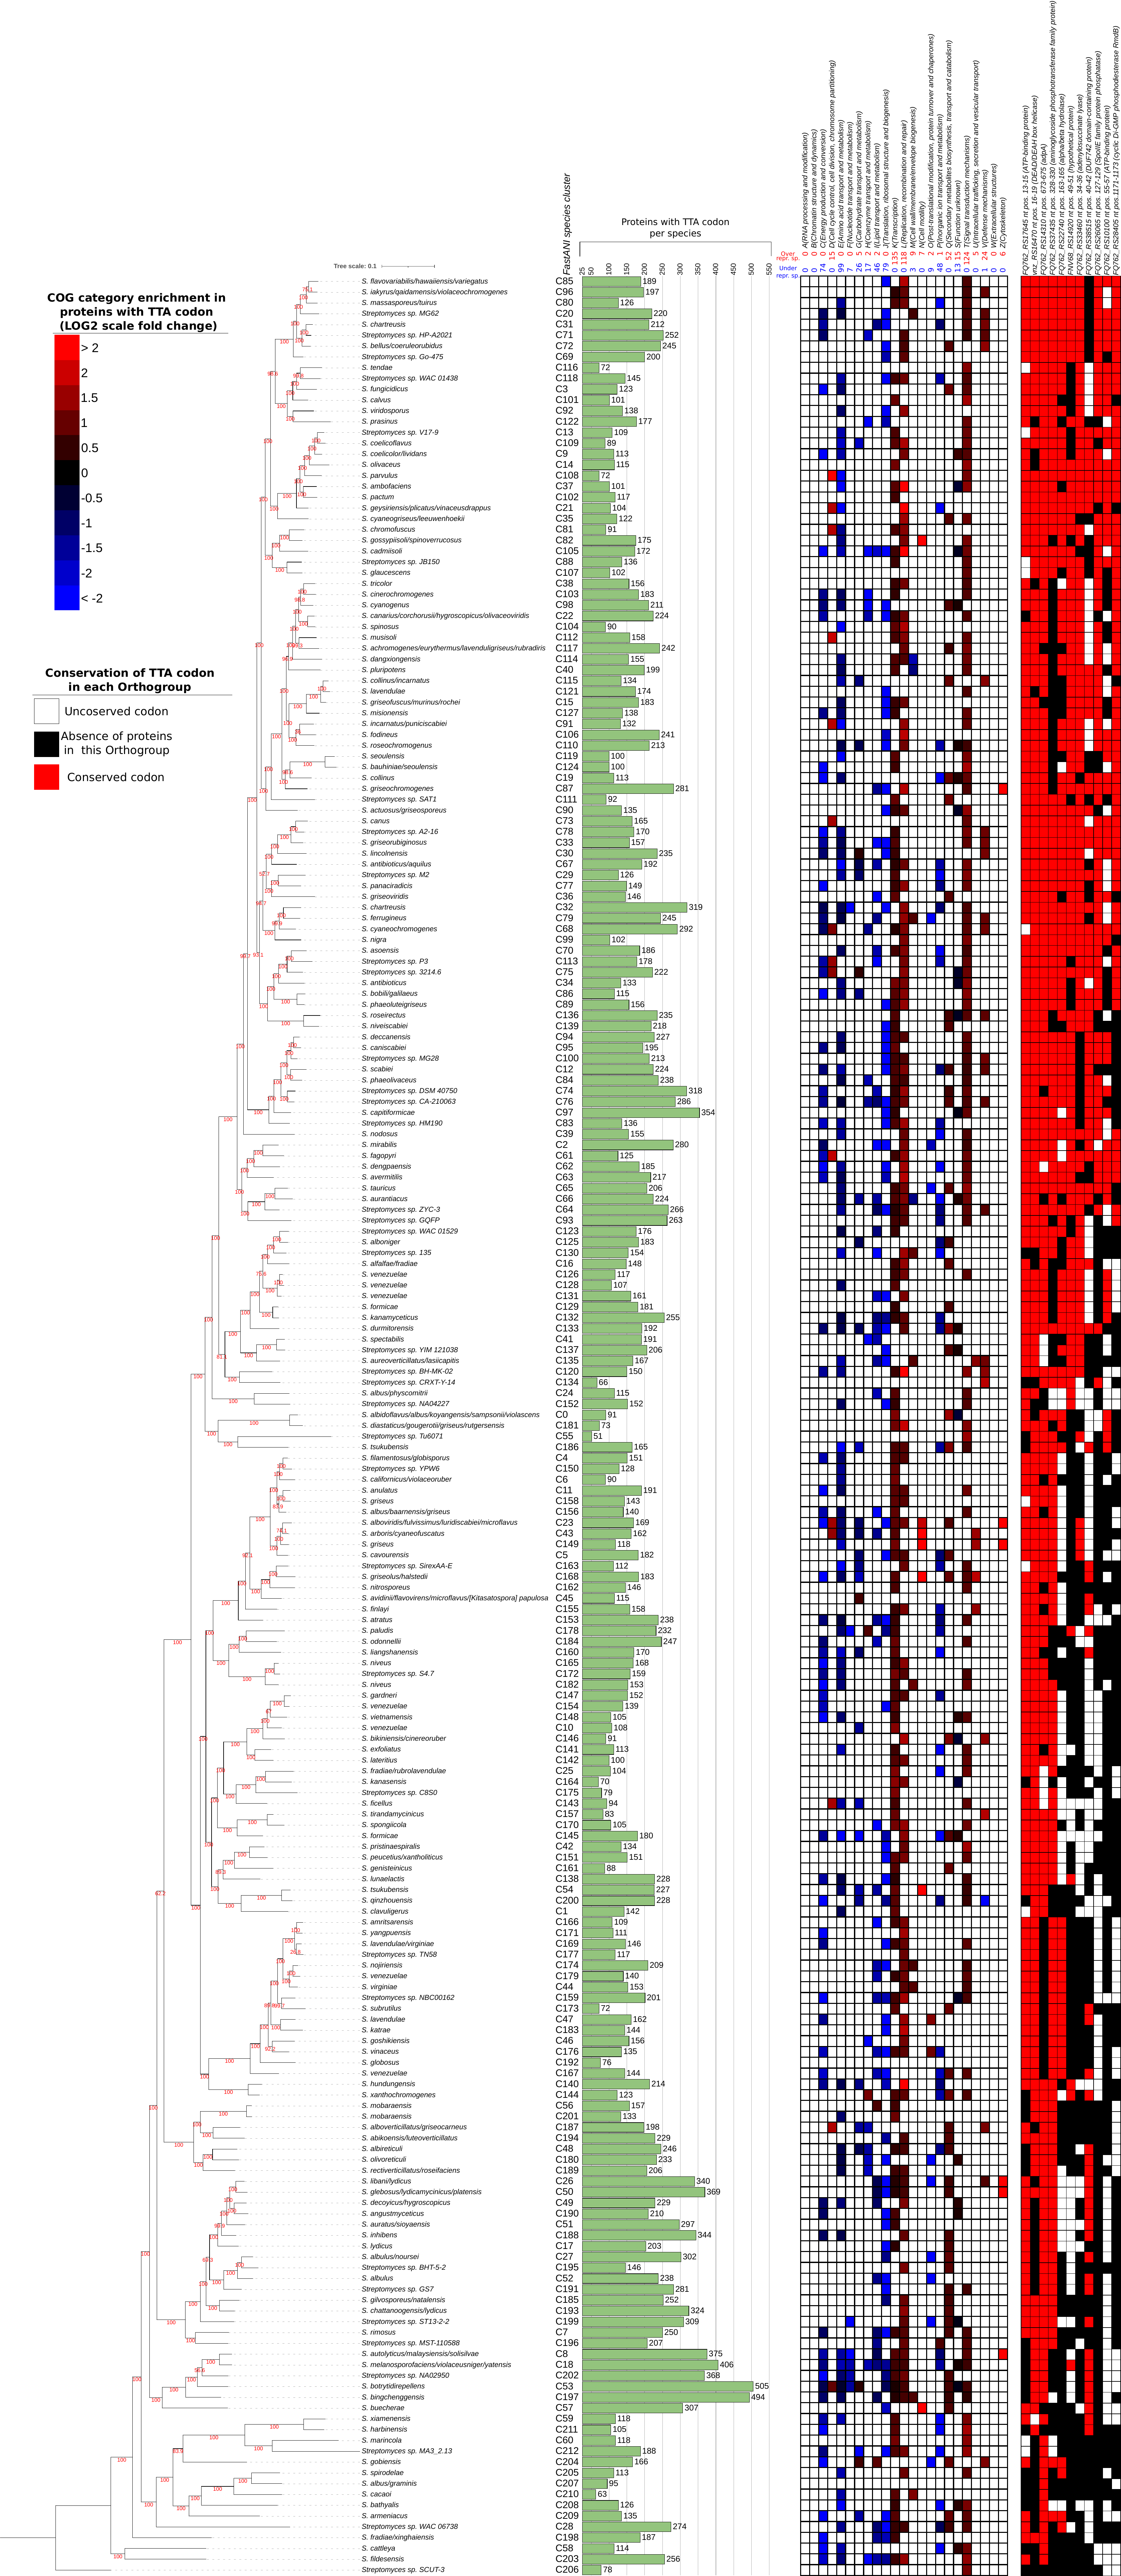
Figure 1. (a) TheStreptomycesphylogenomic species tree is
based on 213 high-qualityStreptomycesgenomes (one
representative from each species) and five other Streptomycetaceae
(as outgroups) and calculated from 318 core protein orthologous
groups (78 205 amino acid sites) using the LG+I+F+G4 model in the
IQ-Tree2 software. Next to the tree, on the first column, we show
the various species names. On the second column is the FastANI
cluster of the corresponding species. On the third column is the
number of high-quality genomes in that species. The next six
columns correspond to the average number of chromosomal proteins,
the number of normalized core proteins, the average number of
accessory proteins, the number of smBGCs in the complete genomes,
the number of relaxed fingerprint proteins, and the number of
smBGCs that are identified as fingerprints, for each species. All
these species data are also summarized as a table in File S1,
spreadsheet 5. (b) Violin plots that show the distribution of
several genomic characteristics of the
analysedStreptomycesspecies (from top to bottom): the
chromosomally encoded proteins for the 213 species; the core
proteins identified in each of the 61 species, with five genomes
(complete and draft) each; the accessory proteins in each of the
61 species; the relaxed fingerprints for the 61 species; the
maximum number of smBGCs in the high-quality genomes of each of
the 213 Streptomycesspecies; intra-species smBGC average
variation, based on Jaccard distance, of the
12Streptomycesspecies that had five complete genomes each;
the maximum number of CAZYmes in the high-quality genomes of each
of the 213Streptomycesspecies; intra-species CAZYme average
variation (based on Jaccard distance), of the
12Streptomycesspecies that had five complete genomes each;
the number of TTA-bearing proteins in the representative
high-quality genomes of each of the 213Streptomycesspecies;
and intra-species TTA-bearing proteins average conservation
variation (based on Jaccard distance), of the 12
Streptomycesspecies that had five complete genomes each.
The dashed line within each violin plot represents the mean value
Figure 2. (a) Number of smBGCs in the
213Streptomycesspecies. Only one high-quality genome with
the highest number of smBGCs for each species was analysed with
antiSMASH. To the left is the phylogenomic tree of the 213
species. The yellow horizontal bars represent the total number of
chromosomally encoded proteins for that species representative.
Next to it, the light blue horizontal bar represents the total
number of smBGCs for that species representative. The smBGC
heatmap only includes the most frequently found (present in at
least 40% of species) smBGCs. Above each column is the type of
smBGC and, in parentheses, the percentage of species that is
present. (b) Number of carbohydrate-active enzymes (CAZymes) in
the various species. The horizontal light blue bars represent the
total number of CAZymes for that species representative. The
CAZyme heatmap shows the abundance of each of the six CAZyme
categories in each species. All these species data are also
summarized in File S1, spreadsheet 5. The orange vertical bar to
the right of the phylogenomic tree represents
theStreptomyceslineage that has a significantly higher
number of genes for these enzymes, compared to the
otherStreptomycesspecies. Red stars denote the 12 species
that were used to calculate the intra-species heterogeneity in the
number of smBGCs, CAZymes and the conservation of TTA-bearing
proteins
Figure 3. Presence of chromosomally encoded TTA-bearing ORFs in
the 213Streptomycesspecies (green bars). Only one
high-quality genome for each species was analysed. To the
immediate right of the barchart is a heatmap of the statistically
significant enrichment of the different COG categories in
TTA-bearing ORFs per species (fold-change on log 2 scale).
Over-representation in a particular category is marked with red
colour, while under- representation is marked with blue colour.
Above the heatmap is the total number of species in which a
certain category is found to be over/under- represented. To the
far right is a presence/absence matrix of the 11 TTA-codons whose
position is conserved in at least 50% of the species that have the
orthogroup. Presence of TTA-bearing ORFs is shown in red, while
absence is shown in white. Orthogroups of TTA-bearing ORFs that
are not present in a certain species are marked black. All these
species data are also summarized in File S1, spreadsheet 5
pyPGCF: a python software for phylogenomic analysis, species
demarcation, identification of core and fingerprint proteins of
bacterial genomes that are important for plants
This computational protocol describes how to use pyPGCF, a python
software that runs in linux environment, in order to analyse
bacterial genomes and perform i) phylogenomic analysis, ii)
species demarcation, iii) identification of core proteins of the
bacterial genus and the individual species, iv) identification of
species-specific fingerprint proteins that are found in all
strains of a species and at the same are absent from all other
species of the genus, v) functional annotation of the core and
fingerprint proteins with eggNOG, vi) identification of secondary
metabolite gene clusters (smBGCs) with antiSMASH. This software
has already been implemented to analyse bacterial genera and
species that are important for plants (i.e. Pseudomonas,
Bacillus). In addition, we provide a test set and example
commands on how to analyse 165 genomes from 55 species of the
genus Bacillus. The main advantages of pyPGCF are that i)
it uses adjustable orthology cutoffs, ii) it identifies
species-specific fingerprints, iii) its computational cost scales
linearly with the number of genomes being analysed. Therefore,
pyPGCF is able to deal with a very large number of bacterial
genomes, in reasonable timescales.
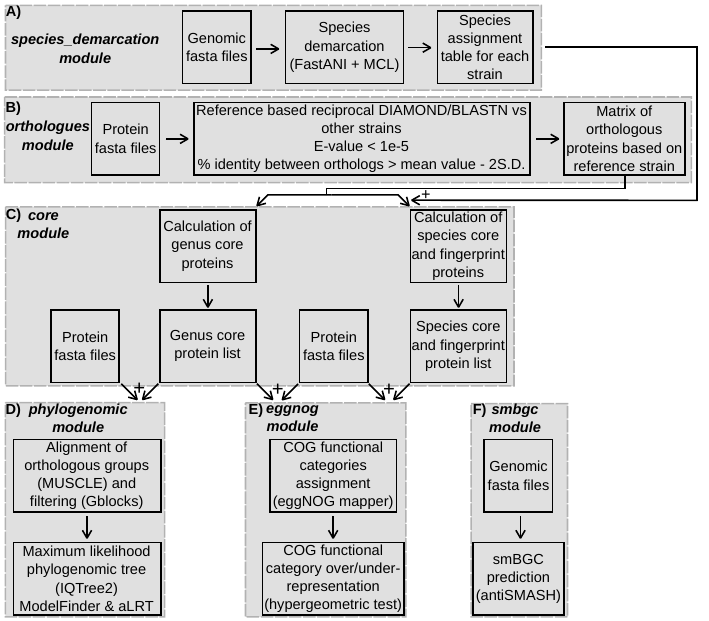
Figure 1. Workflow of the software. A) operations of the
species_demarcation module. B) operations of the
orthologues module. C) operations of the core module.
D) operations of the phylogenomic module.
E) operations of the eggnog module. F) operations of
the smbgc module.
The Notable Achievements and the Prospects of Bacterial Pathogen
Genomics
Throughout the entirety of human history, bacterial pathogens have
played an important role and even shaped the fate of
civilizations. The application of genomics within the last 27
years has radically changed the way we understand the biology and
evolution of these pathogens. In this review, we discuss how the
short- (Illumina) and long-read (PacBio, Oxford Nanopore)
sequencing technologies have shaped the discipline of bacterial
pathogen genomics, in terms of fundamental research (i.e.,
evolution of pathogenicity), forensics, food safety, and routine
clinical microbiology. We have mined and discuss some of the most
prominent data/bioinformatics resources such as NCBI pathogens,
PATRIC, and Pathogenwatch. Based on this mining, we present some
of the most popular sequencing technologies, hybrid approaches,
assemblers, and annotation pipelines. A small number of bacterial
pathogens are of very high importance, and we also present the
wealth of the genomic data for these species (i.e., which ones
they are, the number of antimicrobial resistance genes per genome,
the number of virulence factors). Finally, we discuss how this
discipline will probably be transformed in the near future,
especially by transitioning into metagenome-assembled genomes
(MAGs), thanks to long-read sequencing.
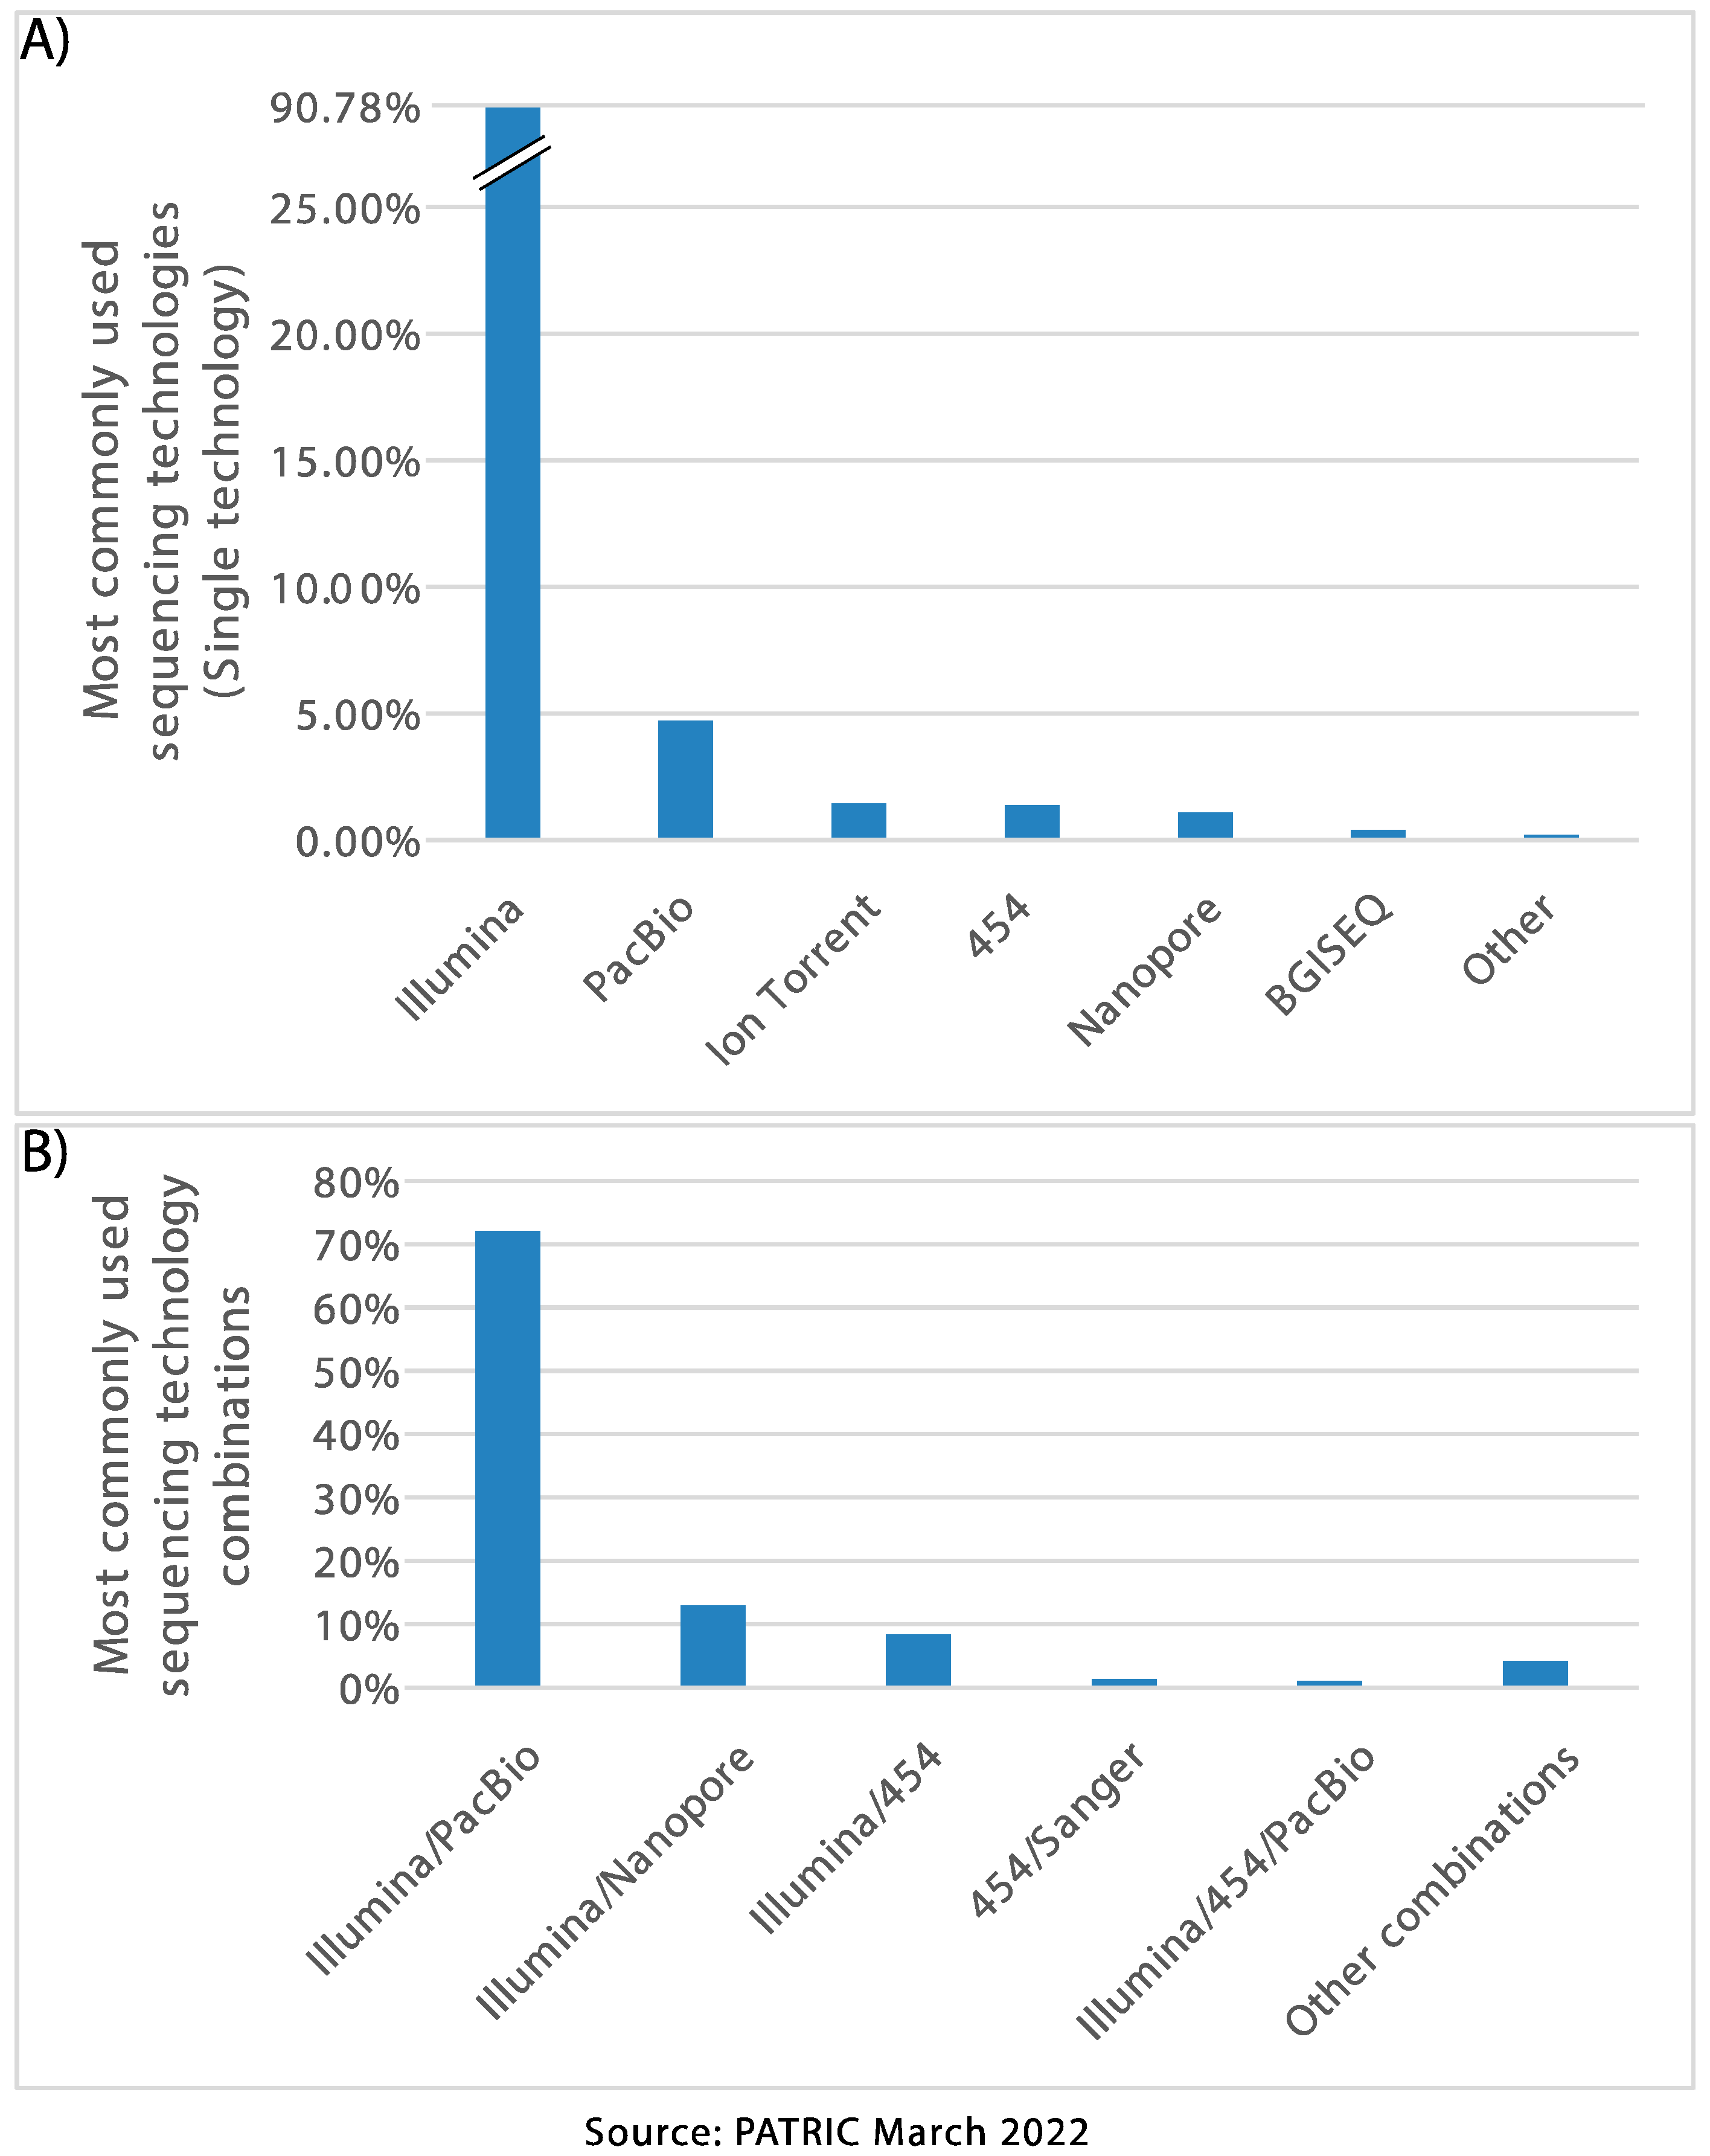
Figure 1. Most frequently used sequencing platforms according to
PATRIC, for bacterial pathogens, (A) used as single technology and
(B) used in combinations (hybrid approaches).
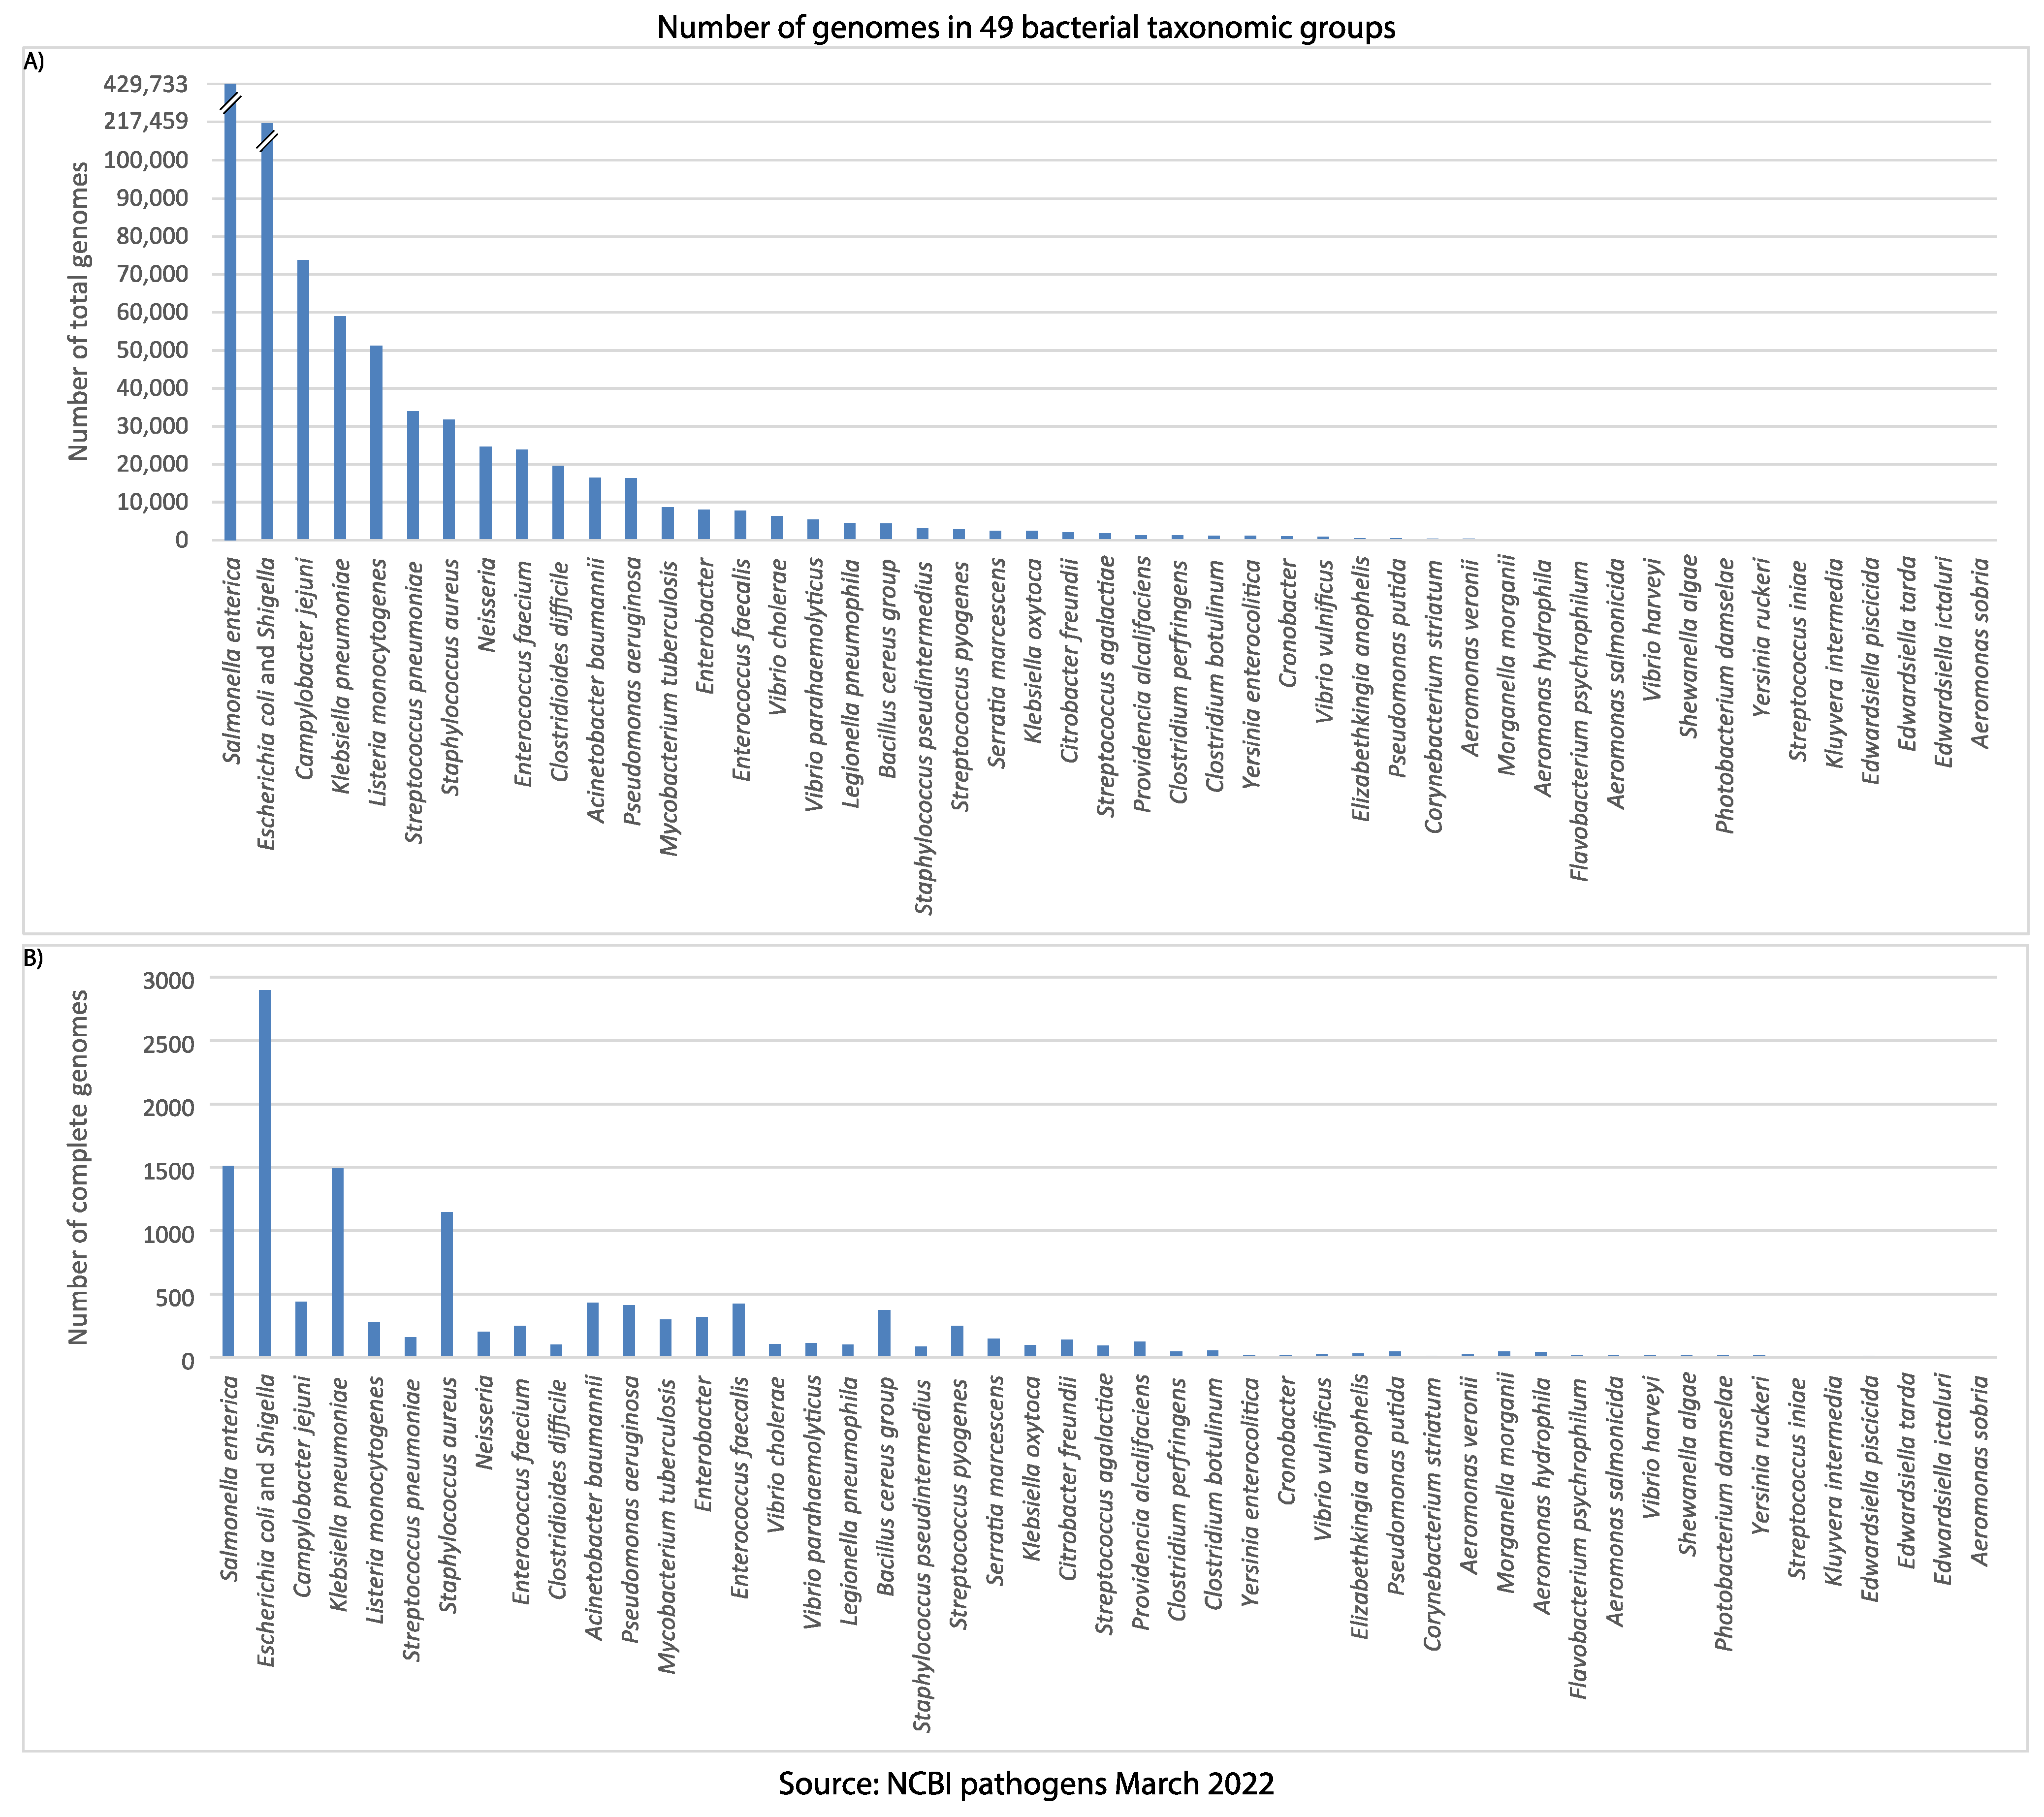
Figure 2. The number of genomes in each bacterial taxonomic group of
the NCBI pathogens. (A) The total number of genomes reported
in each taxonomic group. (B) The number of complete genomes
in each taxonomic group.
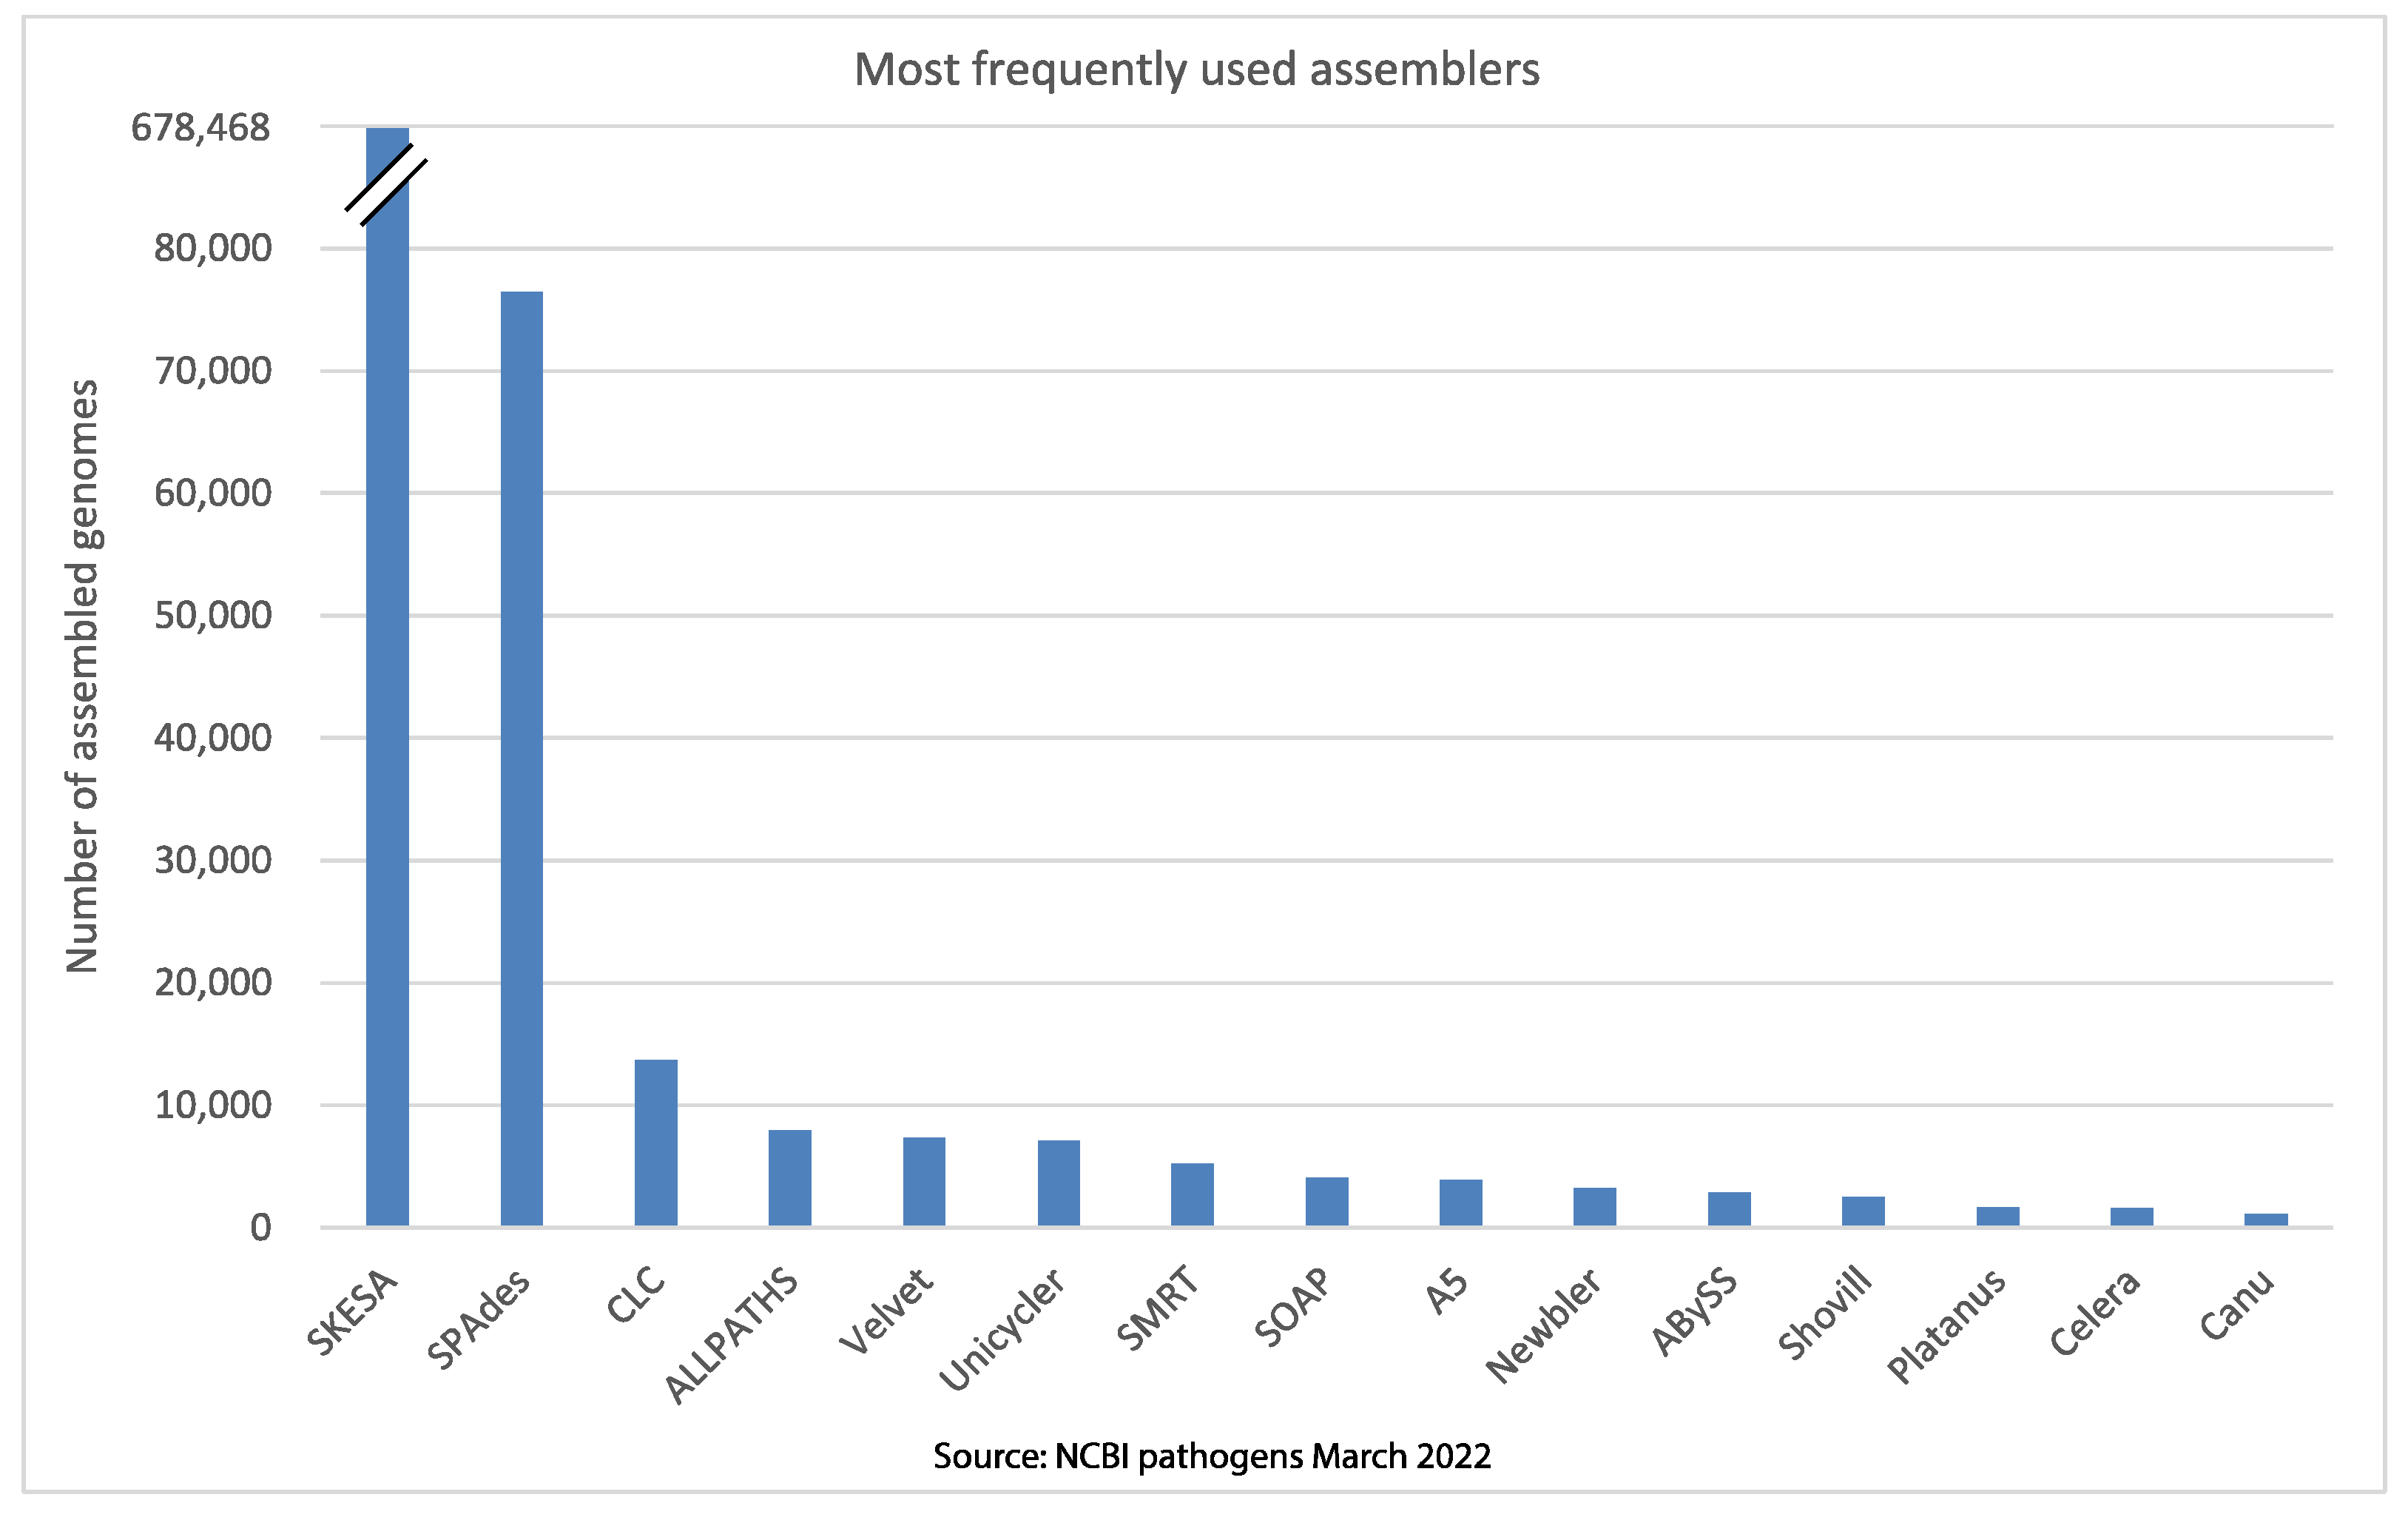
Figure 3. Most of the commonly used assemblers reported in the NCBI
bacterial pathogens database as of March 2022.